Introduction
The Volatility Quality Indicator is a popular technical analysis tool designed for the MetaTrader 5 platform. It is specifically developed to measure and assess market volatility, providing traders with valuable insights into price movements and potential trading opportunities. By utilizing the Volatility Quality Indicator, traders can gain a better understanding of market conditions and make informed trading decisions. In this article, we will explore the features, working principles, and benefits of the Volatility Quality Indicator for MT5.
Features of the Volatility Quality Indicator
The Volatility Quality Indicator offers several features that make it a valuable tool for traders:
- Volatility Measurement: The indicator measures and displays the current level of market volatility. It provides a visual representation of volatility on the price chart, allowing traders to assess the intensity of price movements.
- Adaptive Filtering: The Volatility Quality Indicator utilizes adaptive filtering techniques to smooth out price data and highlight meaningful volatility patterns. This helps traders focus on significant price movements while filtering out noise and insignificant fluctuations.
- Multiple Volatility Measures: The indicator incorporates various volatility measures, including Average True Range (ATR), Standard Deviation, and Bollinger Bands. This comprehensive approach provides a holistic view of market volatility, capturing different aspects of price movements.
- Customizable Parameters: Traders can customize the indicator’s parameters to suit their trading preferences. They can adjust the sensitivity of the volatility measurements, select specific volatility measures to display, and set threshold levels for identifying significant volatility events.
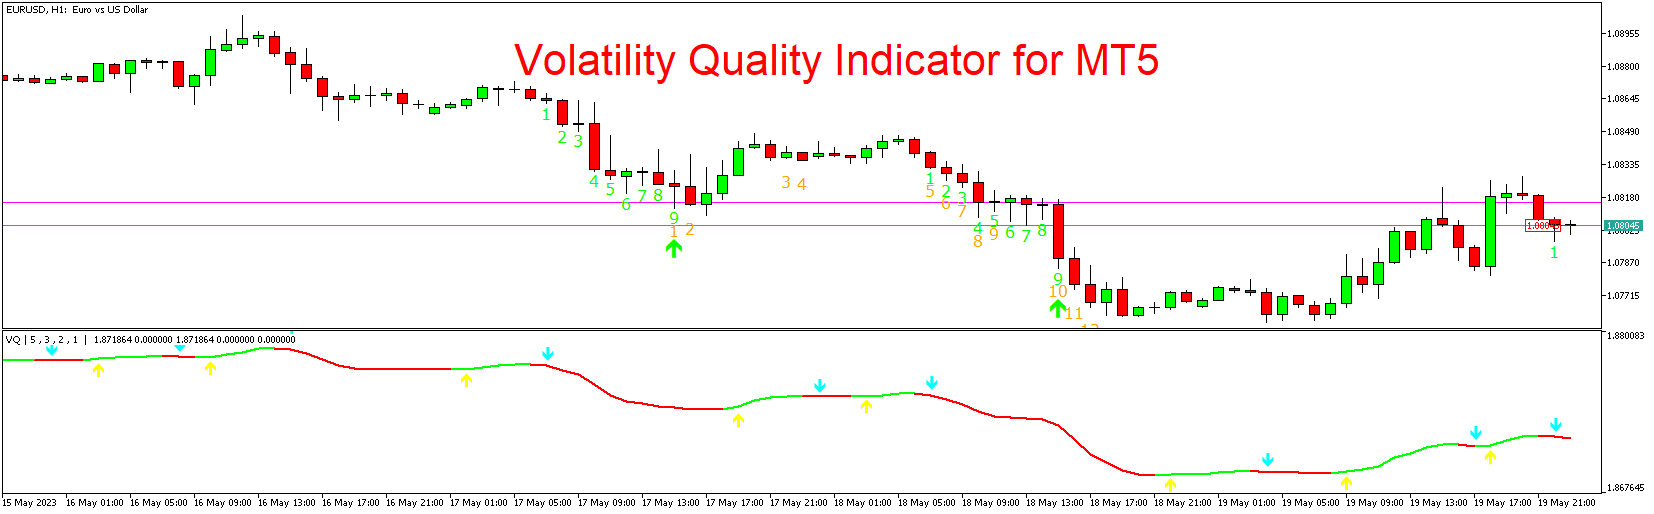
- Visual Representation: The Volatility Quality Indicator presents volatility information through easy-to-read visual cues on the price chart. Traders can observe changes in volatility levels, spot volatility clusters, and identify periods of high or low volatility.
Working Principles of the Volatility Quality Indicator
The Volatility Quality Indicator combines multiple volatility measures to provide a comprehensive assessment of market volatility. The indicator’s working principles include the following:
- Volatility Calculation: The indicator calculates volatility using various methods, such as the Average True Range (ATR), Standard Deviation, or Bollinger Bands. These measures quantify the magnitude of price movements over a specific period.
- Adaptive Filtering: The Volatility Quality Indicator applies adaptive filtering techniques to smooth out price data and emphasize significant volatility patterns. This adaptive approach helps traders focus on meaningful volatility events while reducing the impact of market noise.
- Volatility Thresholds: Traders can set custom threshold levels to identify significant volatility events. By defining specific levels of volatility, traders can filter out minor price fluctuations and concentrate on significant market moves that may present trading opportunities.
- Visual Representation: The indicator visually represents volatility levels on the price chart. It uses different colors or line styles to indicate varying degrees of volatility, allowing traders to identify periods of high or low volatility at a glance.
Benefits of the Volatility Quality Indicator
- Volatility Assessment: The Volatility Quality Indicator provides a clear assessment of market volatility, helping traders gauge the intensity of price movements. This information is crucial for understanding market dynamics and adjusting trading strategies accordingly.
- Trading Opportunity Identification: By observing volatility clusters and significant volatility events, traders can identify potential trading opportunities. Periods of high volatility often coincide with increased trading activity and the potential for larger price movements.
- Risk Management: Understanding market volatility is essential for effective risk management. The Volatility Quality Indicator can help traders assess the potential risk associated with their trades and adjust position sizes or implement appropriate risk management strategies accordingly.
- Confirmation of Breakouts: Volatility often accompanies breakout movements in the market. Traders can use the Volatility Quality Indicator to confirm the validity of breakouts and identify situations where volatility supports the breakout signal.
Conclusion
The Volatility Quality Indicator is a powerful tool for assessing market volatility and identifying potential trading opportunities. By utilizing its comprehensive volatility measures, adaptive filtering techniques, and visual representation of volatility, traders can gain valuable insights into market dynamics. Whether you are a beginner or an experienced trader, incorporating the Volatility Quality Indicator into your trading strategy can enhance your understanding of market volatility, improve your risk management, and help you make more informed trading decisions.
Download indicator