Introduction
The DeMark Trend Lines Indicator is a powerful technical analysis tool designed for the MetaTrader 5 platform. It helps traders identify and draw key trend lines on their price charts, providing valuable insights into market trends and potential reversal points. By utilizing the DeMark Trend Lines Indicator, traders can enhance their trend analysis and develop more effective trading strategies. In this article, we will explore the features, working principles, and benefits of the DeMark Trend Lines Indicator for MT5.
Features of the DeMark Trend Lines Indicator
The DeMark Trend Lines Indicator offers several features that make it a valuable tool for traders:
- Automatic Trend Line Drawing: The indicator automatically identifies and draws trend lines on the price chart based on specific criteria. This saves time and effort for traders, as they no longer need to manually draw trend lines.
- Customizable Parameters: Traders can customize the indicator’s parameters to suit their trading preferences. They can adjust the sensitivity of the indicator, the minimum number of price touches required to validate a trend line, and other settings.
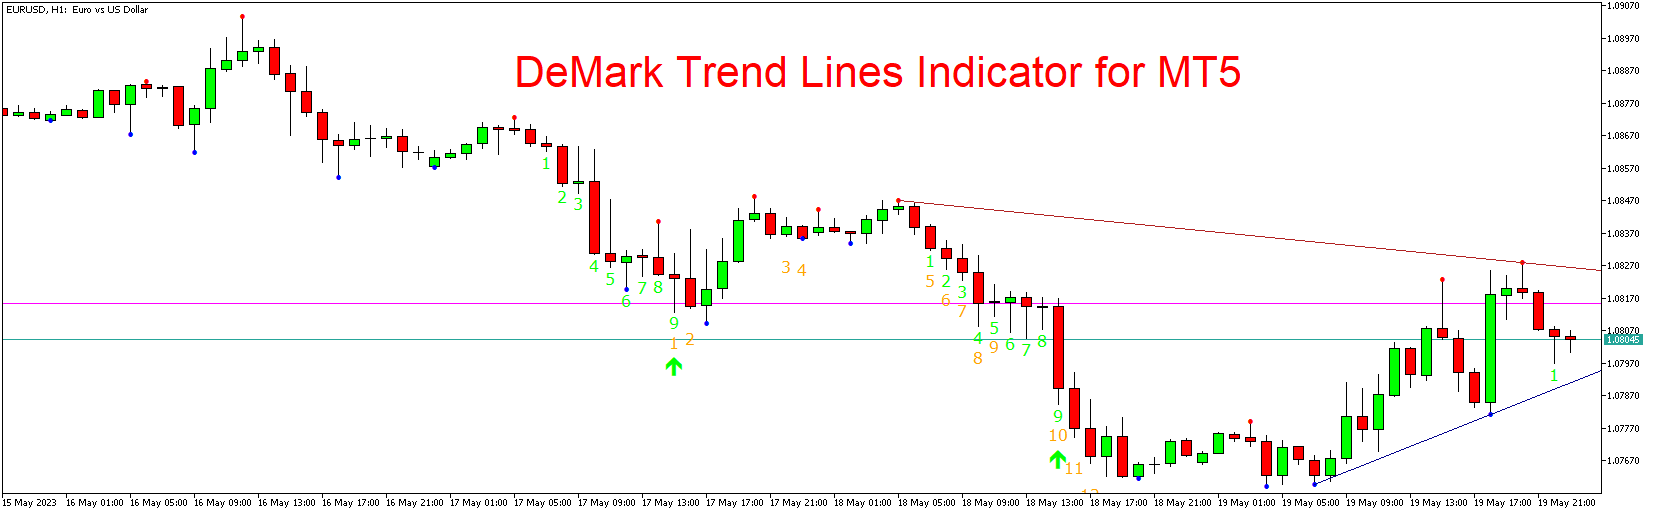
- Bullish and Bearish Trend Lines: The indicator distinguishes between bullish and bearish trend lines, providing visual clarity on the direction of the trend. This helps traders identify both upward and downward trends in the market.
- Reversal Points: The DeMark Trend Lines Indicator also highlights potential reversal points in the market. It identifies trend lines that have been broken or violated, indicating a possible trend reversal or change in market direction.
- Visual Representation: The trend lines drawn by the indicator are displayed on the price chart, making it easy for traders to visualize and interpret the trend analysis. Traders can easily identify trend line breakouts, confirm trend direction, and plan their trading strategies accordingly.
Working Principles of the DeMark Trend Lines Indicator
The DeMark Trend Lines Indicator is based on the principles developed by Tom DeMark, a renowned technical analyst. It utilizes specific criteria to identify and draw trend lines on the price chart. The indicator follows the following principles:
- Swing Highs and Lows: The indicator identifies swing highs and lows in the price chart. A swing high occurs when a price peak is followed by lower highs, indicating a potential downward trend. Conversely, a swing low occurs when a price trough is followed by higher lows, indicating a potential upward trend.
- Validation Points: The indicator requires a minimum number of price touches to validate a trend line. For example, a trend line drawn based on swing highs should have at least two lower swing highs to confirm its validity. This helps filter out false signals and strengthens the reliability of the trend lines.
- Breakouts and Reversals: The DeMark Trend Lines Indicator identifies trend line breakouts, where the price breaches the trend line. This may indicate a potential trend reversal or a continuation of the existing trend. Traders can use these breakout points to enter or exit trades.
Benefits of the DeMark Trend Lines Indicator
- Trend Identification: The DeMark Trend Lines Indicator helps traders identify and visualize trends in the market. By drawing trend lines automatically, traders can quickly assess the direction of the trend and adjust their trading strategies accordingly.
- Reversal Points: The indicator highlights potential trend reversals, allowing traders to anticipate market turns and adjust their positions. This can be particularly useful for swing traders and those looking to capture trend reversals.
- Confirmation of Breakouts: The indicator’s ability to identify trend line breakouts can help traders confirm price movements and validate their trading decisions. Breakouts can signal the start of a new trend or provide confirmation of an existing one.
- Time-saving and Efficiency: The DeMark Trend Lines Indicator automates the process of drawing trend lines, saving traders time and effort. Traders can focus on analyzing the trend lines and making informed trading decisions rather than manually drawing lines on their charts.
Conclusion
The DeMark Trend Lines Indicator is a valuable tool for traders looking to enhance their trend analysis and develop effective trading strategies. With its automatic trend line drawing, customizable parameters, and identification of reversal points, the indicator provides valuable insights into market trends. By incorporating the DeMark Trend Lines Indicator into your trading arsenal, you can gain a deeper understanding of market dynamics, improve your trading accuracy, and make more informed trading decisions.
Download indicator