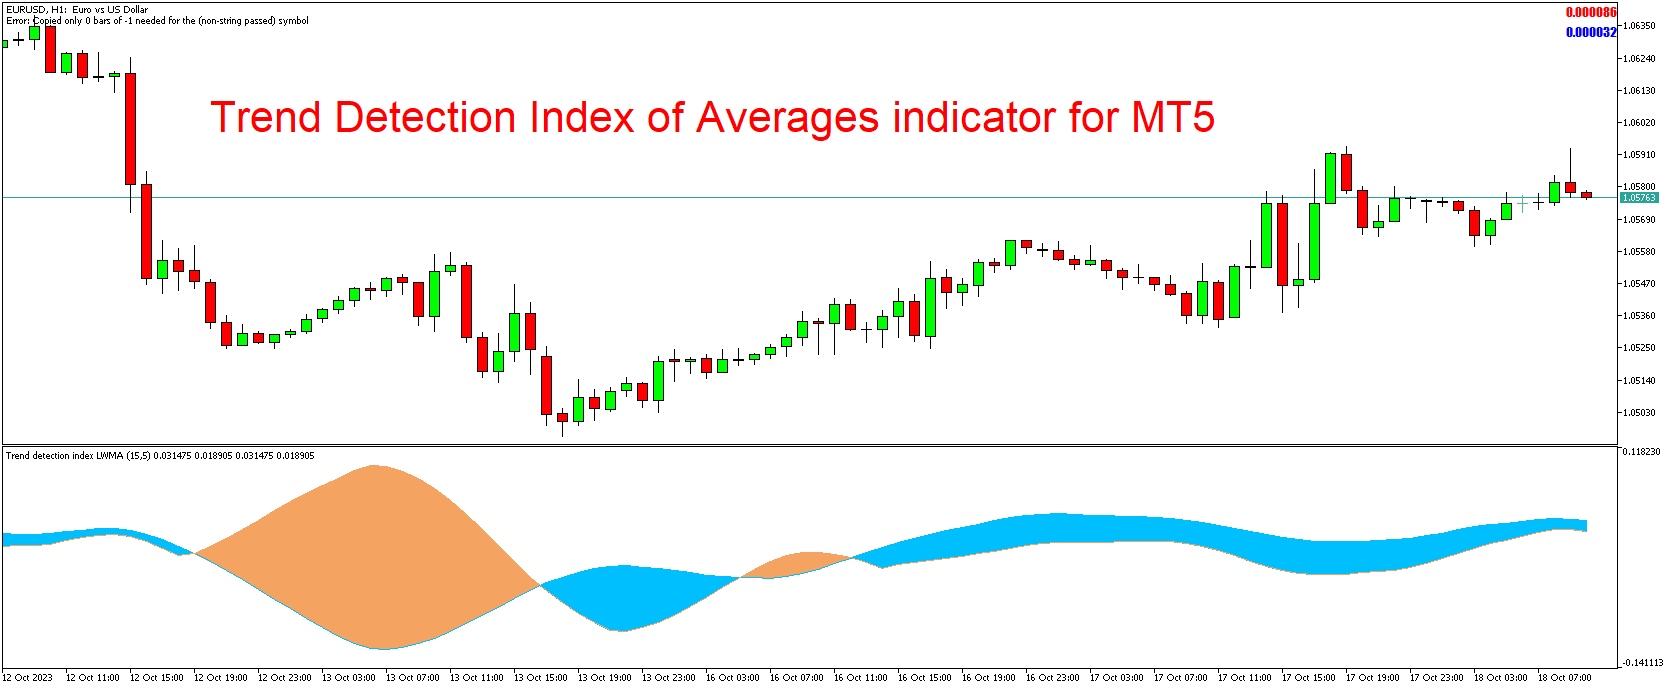
In the dynamic world of trading, having the right tools can significantly impact your decision-making process. Technical indicators play a crucial role in helping traders analyze market conditions and make informed choices. The Trend Detection Index of Averages Indicator for MetaTrader 5 (MT5) is one such tool that provides traders with unique insights into market trends and potential reversal points. In this article, we’ll explore the Trend Detection Index of Averages Indicator, understand its practical applications, and guide you on how to download and integrate it into your MetaTrader 5 platform for free.
Introducing
The Trend Detection Index of Averages Indicator, or TDI for short, is an advanced technical analysis tool designed to offer traders a comprehensive view of market trends and potential reversal points. It combines several popular technical indicators into one visual representation, providing a clear perspective on market dynamics. This comprehensive approach allows traders to assess the strength of a trend and potential trend reversals with greater accuracy.
One of the standout features of this indicator is its ability to distill complex market data into a visually appealing format, making it accessible to traders of all levels.
Applications of the Trend Detection Index of Averages Indicator
- Trend Identification: The primary application of the Trend Detection Index of Averages Indicator is to identify trends. It does this by combining various moving averages and relative strength measurements into one visually intuitive chart. Traders can assess the direction and strength of a trend based on the position of the indicator line.
- Trend Strength Assessment: This indicator helps traders evaluate the strength of a trend. A strong trend is typically associated with a more significant gap between the indicator line and the central zero line. Conversely, a weaker trend will have the indicator line closer to the zero line.
- Overbought and Oversold Conditions: Like many other oscillators, the TDI Indicator can also be used to identify overbought and oversold conditions. When the indicator line reaches extreme levels, it may suggest that the market is overextended and due for a correction.
- Divergence Analysis: Traders often use divergence between the indicator line and price as a signal. Divergence can indicate potential trend reversals, and the TDI Indicator can help traders spot such opportunities.
How to Download the Trend Detection Index of Averages Indicator for MT5
The Trend Detection Index of Averages Indicator is available for free on the MetaTrader 5 (MT5) platform. Here’s a step-by-step guide on how to download and install it:
- Access Your MetaTrader 5 Platform: Ensure you have the MetaTrader 5 platform installed on your computer or mobile device.
- Log In or Create an Account: If you don’t have a MetaTrader 5 account, create one or log in with your existing account details.
- Open the Navigator Window: In MetaTrader 5, locate the Navigator window, usually situated on the left side of the platform.
- Select ‘Indicators:’ Within the Navigator window, you’ll find a category labeled ‘Indicators.’ Click on it.
- Search for the Trend Detection Index of Averages Indicator: In the Indicators section, search for the Trend Detection Index of Averages Indicator. Once you find it, double-click on it.
- Configure the Indicator: After double-clicking, you can customize the indicator settings according to your preferences. Click ‘OK’ to apply these settings to your chart.
- Apply the Indicator to Your Chart: To use the indicator, drag and drop the Trend Detection Index of Averages Indicator onto your trading chart.
With the Trend Detection Index of Averages Indicator now seamlessly integrated into your MetaTrader 5 platform, you have a powerful and comprehensive tool at your disposal to analyze market trends and potential reversal points.
Conclusion
The Trend Detection Index of Averages Indicator is a valuable addition to any trader’s technical analysis toolkit. Its ability to identify trends, assess trend strength, highlight overbought or oversold conditions, and identify divergence provides traders with a comprehensive view of market conditions.
Download indicator
