Definition
TDI RT Clone indicator is a trading system that determines the market volatility, divergence, and trend reversal. It is a complete trading system that can be used to open and close trades in the financial market.
What are the components of the TDI RT Clone indicator?
Trader dynamic index Divergence indicator consists of the following components:
- RSI indicator
- Bollinger bands indicator
- Trend or moving average indicators
These three combinations of indicators play their part in trading and form a complete trading system. Each indicator has its own significance. A trader should use all the indicators as a confluence to open a buy or sell trade.
How does the TDI RT Clone indicator work?
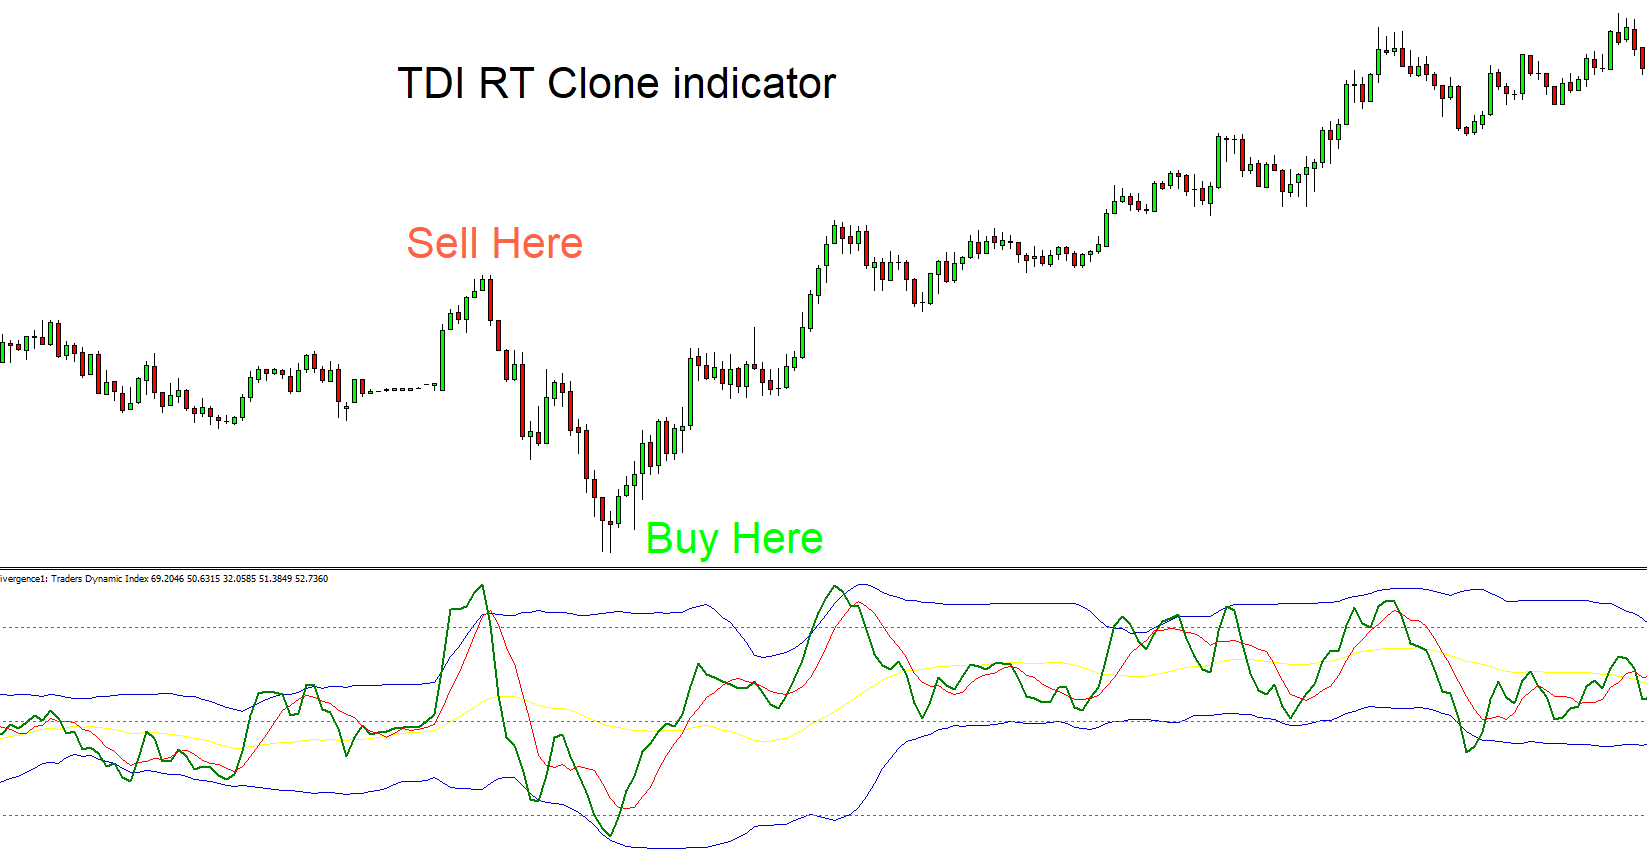
There are five lines in this trading system. I will explain the function of each line with respect to the price action in trading.
The green line is an RSI line with 14 periods. It shows the overbought and oversold regions with divergence. The relative strength index indicator also shows the divergence.
The first step in this trading system is to check this green line. If it is forming a bearish or bullish divergence then you should check the red line. The red line is a fast period moving average. If the RSI indicator is forming a bullish divergence then wait for the RSI line to cross the red line.
After this setup, the next step is to check the yellow line. It is a slow period moving average line that shows the direction of the trend. It must be in an upward direction in the case of a bullish setup while it must be in a downward direction in the case of a bearish setup.
The two blue lines forming at the upper and lower portion are the Bollinger band lines. These lines show market volatility. During high market volatility, these lines widen apart from each other while during low volatility these lines come close to each other.
TDI RT Clone indicator signals
Buy signal
First of all, check the market volatility using two blue lines. It must show low volatility. Then check the bullish divergence on the green line and wait for a crossover with the red line. After this open a buy order and add take profit levels using the yellow line.
Sell signal
Check the market volatility using the two blue lines. It must show low volatility. Then check the bearish divergence in the overbought region with the crossover of the red line. Then open a sell order and add take profit levels using the yellow line.
Conclusion
TDI RT Alert divergence indicator is a complete trading system and it also alerts about the buy or sells signals.
You can set up custom alerts according to your own preferences.
Download indicator