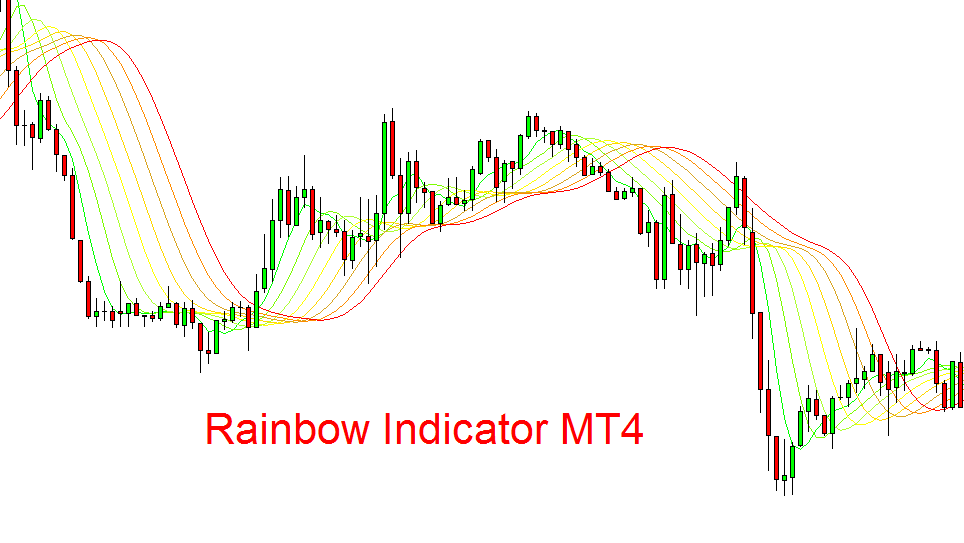
The Rainbow indicator is an mt4 technical indicator that is made up of seven different moving averages to make a rainbow of support or resistance. This rainbow act as a support or resistance zone.
Moving averages are used to determine the direction of the trend and to find the dynamic support or resistance levels. Price respects the moving averages.
How does rainbow mt4 indicator work?
As the moving averages are used to find the key levels on the chart. But sometimes they are not able to give exact reversal points. That’s why there is a system of seven moving averages in rainbow indicators that are all used to find key reversal levels on the chart.
These seven moving averages make a wide zone. This wide zone act as a support or resistance level.
Price bounces from the rainbow of moving averages. After the breakout of the rainbow, a price trend reversal occurs. Then price trend changes.
- If price breaks the rainbow of moving averages with a big bullish candlestick breaching through all the moving averages then the price trend changes from bearish into bullish.
- On the other side, if the price breaks the rainbow with a big bearish candlestick breaching through all the moving averages then the price trend changes from bullish into bearish.
Also Learn about the Money Flow index indicator
Types of moving averages used in rainbow indicator
There are seven moving averages with the different periods are used in the rainbow indicator. You can also change the period according to the requirements. But we will recommend you to use the moving averages with the following periods from low to high.
- 9 Period
- 16 Period
- 21 Period
- 35 Period
- 41 Period
- 55 Period
- 61 Period
These are recommended moving averages to be used to make a rainbow of moving averages. You can assign different colors depending on the strength of each moving average.
Rainbow indicator signals in mt4
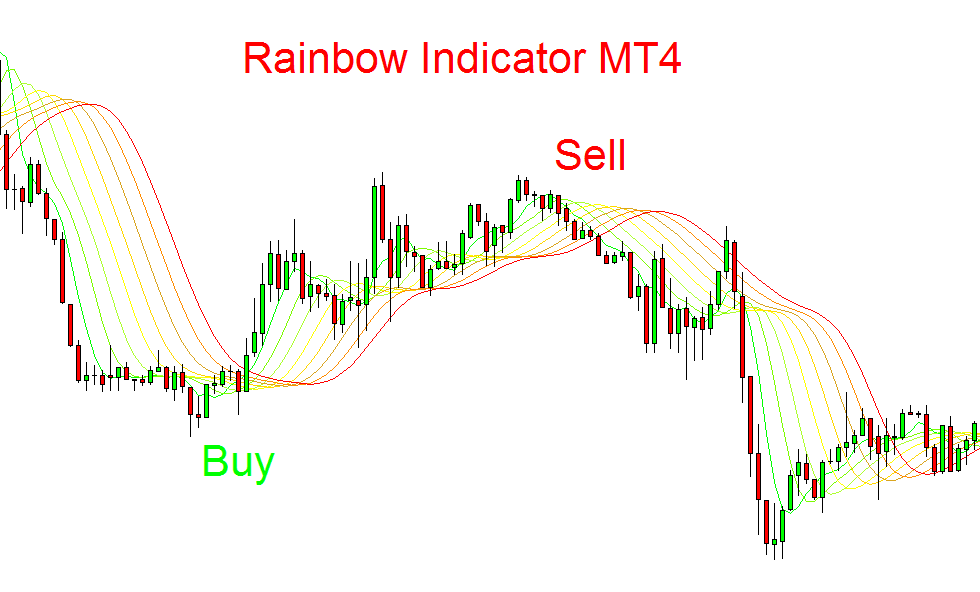
Buy signal
When a big bullish candlestick breaches through the seven moving averages and closes above the MAs then it shows a buy signal. You should stay in the long direction until a price breaks the 61 Period moving average in opposite direction.
Sell signal
When a big bearish candlestick breach through the seven moving averages and close below then it shows a sell signal. Keep on holding a sell position until a breakout of 61 periods moving average does not happen in opposite direction.
Conclusion
Rainbow indicator in mt4 is the best and simplistic indicator for newbie traders. It can also generate profits in the forex market if traded with other confluences like chart patterns or trading indicators.
Use candlestick patterns to get high accuracy and winning signals with rainbow indicator.
Download indicator