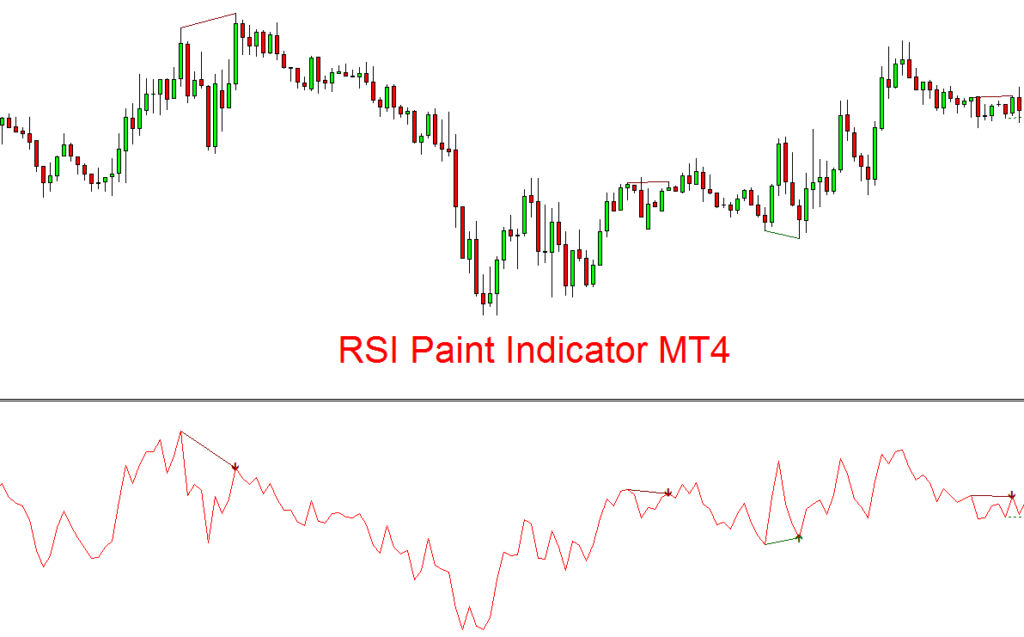
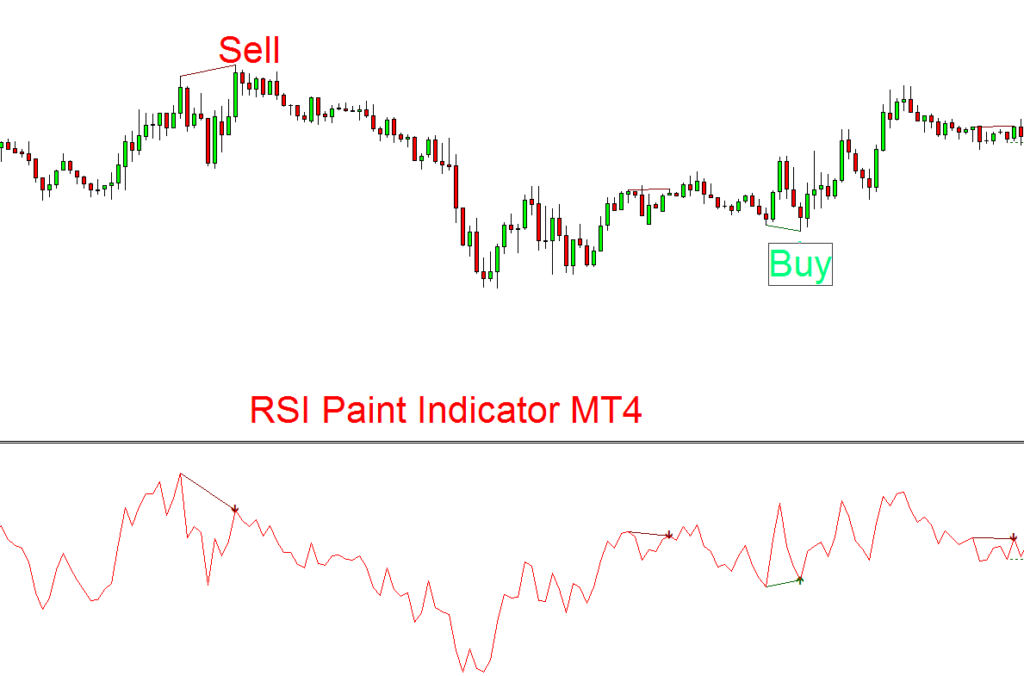
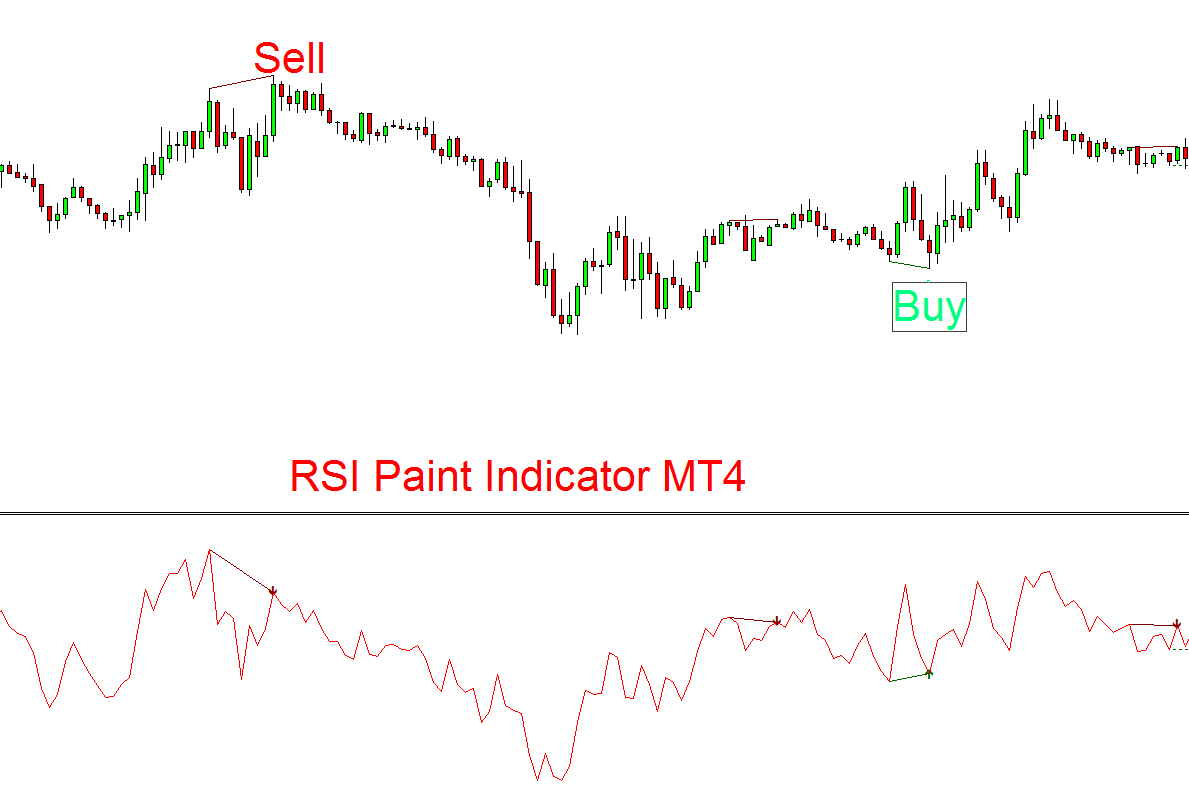
RSI paint indicator is an mt4 technical indicator that shows the overbought and oversold conditions on the chart. It also shows real-time divergence on the chart.
You can use divergence to detect reversals on the chart.

Working of RSI paint indicator
RSI paint indicator is used to identify overbought and oversold conditions. It also draws the divergence lines on lower lows or higher highs on the chart.
How does the indicator Identify the RSI divergence?
This indicator uses the higher high and lowers low values of the price chart and indicator to draw a divergence line in overbought or oversold conditions.
It will detect bullish trend reversal only in overbought conditions and bearish trend reversal only in an oversold condition. That’s why it plays an important part in determining the reversal conditions.
RSI paint mt4 indicator draws red and green lines according to conditions.
Bearish Rsi paint divergence
If the price on the chart forms lower lows but on the other hand, the indicator is forming a higher low then the indicator draws a red line. It is also called a bearish trend reversal. After this type of divergence, the bearish trend is converted into a bullish trend.
Bullish Rsi paint divergence
If price forms higher highs on the chart and indicator forms lower high then the indicator draws a green line. It is also called bullish trend reversal. The price trend changes from bullish into bearish after the formation of this green line.
RSI paint indicator signals
This indicator draws a bullish or Bearish arrow. The arrow shows the buy or sell signals.
When to buy
When the indicator draws a green line with a bullish green arrow then a buy signal is generated. You should buy just after the formation of a green arrow.
When to sell
When the indicator draws a red line with a bearish red arrow then a sell signal is generated. You should sell just after the formation of a green arrow.

Conclusion
The relative strength index is an indicator that represents either the price is overbought or oversold. You should only buy when the price is oversold.
You can also add a confluence of this RSI paint indicator with any other price action technique to increase the winning ratio of a trading system.
Download indicator
