The Keltner Channel Indicator is a popular technical analysis tool used by traders to identify trends and market volatility. It is a volatility-based indicator that uses the average true range (ATR) to set the width of the channel. In this article, we will discuss the definition, working, and best settings of the Keltner Channel Indicator, and how to use it to trade in MT5.
Definition
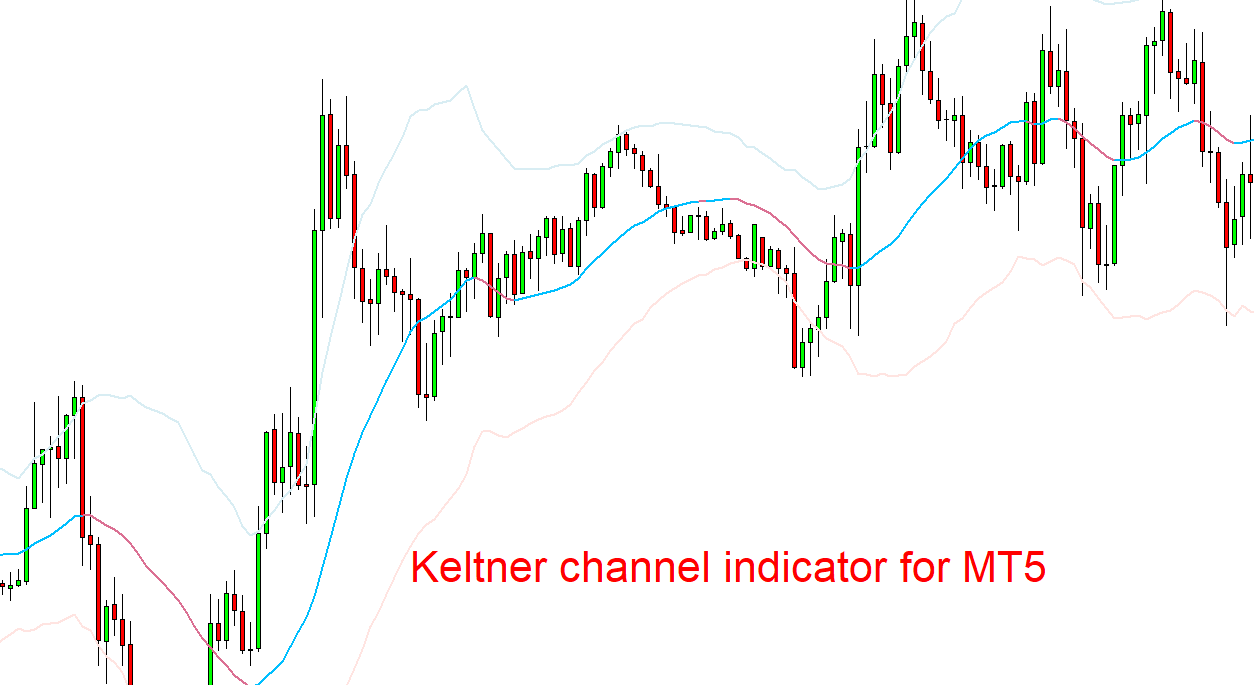
The Keltner Channel Indicator is a technical analysis tool that consists of an upper and lower band plotted around the price of the security. The Keltner Channel uses the ATR to set the width of the channel, which means that the channel width expands during periods of high volatility and contracts during periods of low volatility.
Working of Keltner Channel Indicator in MT5
The Keltner Channel Indicator is calculated using the following formula:
Middle Line = Exponential Moving Average (EMA) Upper Channel Line = Middle Line + (Multiplier * ATR) Lower Channel Line = Middle Line – (Multiplier * ATR)
Where Multiplier is a factor that determines the width of the channel, and ATR is the average true range of the security.
The Keltner Channel Indicator can be used to identify trends and market volatility. When the price is trading above the upper band, it indicates that the security is overbought, and when the price is trading below the lower band, it indicates that the security is oversold.
Best Settings for Keltner Channel Indicator
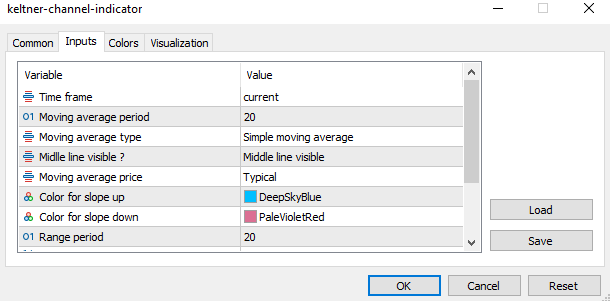
The best settings for the Keltner Channel Indicator depend on the trading strategy and the time frame being used. Generally, a shorter time frame, such as 20 periods, is used for intraday trading, while a longer time frame, such as 50 or 100 periods, is used for swing trading.
The table below shows the best settings for the Keltner Channel Indicator for different time frames:
| Time Frame | Period | Multiplier |
|---|---|---|
| Intraday | 20 | 1.5 |
| Swing | 50 | 2.0 |
| Positional | 100 | 2.5 |
How to Trade with Keltner Channel Indicator?
The Keltner Channel Indicator can be used in a variety of trading strategies. Here are two common ways to use the Keltner Channel Indicator to trade in MT5:
- Open a Buy Trade: When the price of the security crosses above the upper band of the Keltner Channel, it indicates that the security is overbought, and a buy signal is generated. Traders can look for a bullish candlestick pattern as confirmation of the buy signal.
- Open a Sell Trade: When the price of the security crosses below the lower band of the Keltner Channel, it indicates that the security is oversold, and a sell signal is generated. Traders can look for a bearish candlestick pattern as confirmation of the sell signal.
Features of Keltner Channel Indicator
The Keltner Channel Indicator has several features that make it a useful tool for traders. Some of these features include:
- Identifying trends and market volatility
- Generating buy and sell signals
- Customizable settings to suit different trading strategies
- Works well with other technical analysis tools, such as candlestick patterns and moving averages.
Conclusion
The Keltner Channel Indicator is a powerful tool that can be used to identify trends and market volatility, generate buy and sell signals, and customize settings to suit different trading strategies. Traders should experiment with different settings and time frames to find the best combination for their trading strategy. By using the Keltner Channel Indicator in combination with other technical analysis tools, such as candlestick patterns and moving averages, traders can increase their chances of success in the markets.
Download Link
To download the Keltner Channel Indicator for MT5, click the download button below. Once you have downloaded the indicator, you can easily install it in your MT5 platform and start using it in your trading.
Download