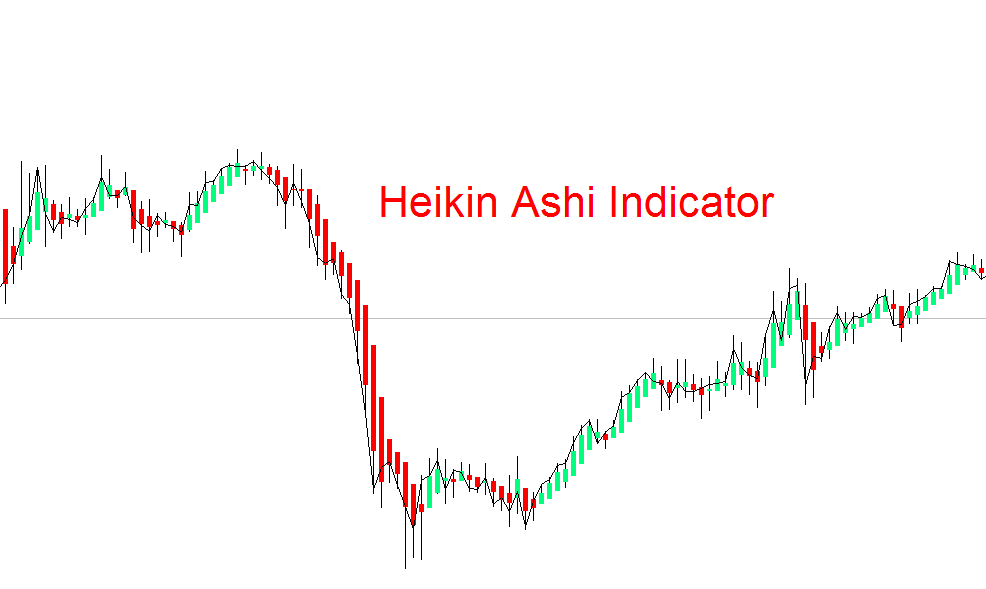
Heikin Ashi indicator is a type of mt4 indicator that shows the average of high, low, open, and close prices on the chart in the form of the candlestick. Heikin Ashi resembles a candlestick chart but it uses the average value to determine the OHLC values.
In the metatrader, The Heikin Ashi chart is not available. You have to manually apply the Heiken Ashi indicator to the mt4 chart. The indicator will plot Heiken Ashi candlesticks on the chart. it is also denoted by the HA indicator.
The formula used in heikin ashi mt4 indicator
A candlestick consists of four OHLC values. OHLC means open, high, low, and close price. Heikin Ashi candlestick is a more advanced form of the simple candlestick. There is a simple formula that’s used in the mt4 indicator.
- Close price of Heikin Ashi = average of open, high, low, and close
- Open price of Heikin Ashi = average of previous heikin ashi candlestick open and close
- The high price of Heikin Ashi = maximum high of open, close or high
- Low price of Heikin Ashi = minimum low of open, close or low
Why Heiken Ashi indicator is important?
As this indicator uses the average values to display output on the chart, it is useful to identify a true trend reversal. For example, a simple candlestick chart gives many false trend reversal signals because it uses the current market values. But heikin ashi uses average values and it takes time to show a reversal signal.
Most of the retail traders use the Heiken Ashi indicator with a price action strategy to increase the winning probability and to hold the trade for a longer time. If you are not able to hold the trade then we will recommend you to use the Heiken Ashi indicator.
How does the HA indicator work in mt4?
In the Heikin Ashi indicator, the buying trend is indicated by the green candlestick, and the sell trend is indicated by red candlesticks. The color of candlesticks matters a lot in hiking ashi indicators. Because the color of candlesticks indicates the trend continuation or trend reversal.
For example, if the color changes from red to green then the trend will reverse from bearish into bullish and vice versa.
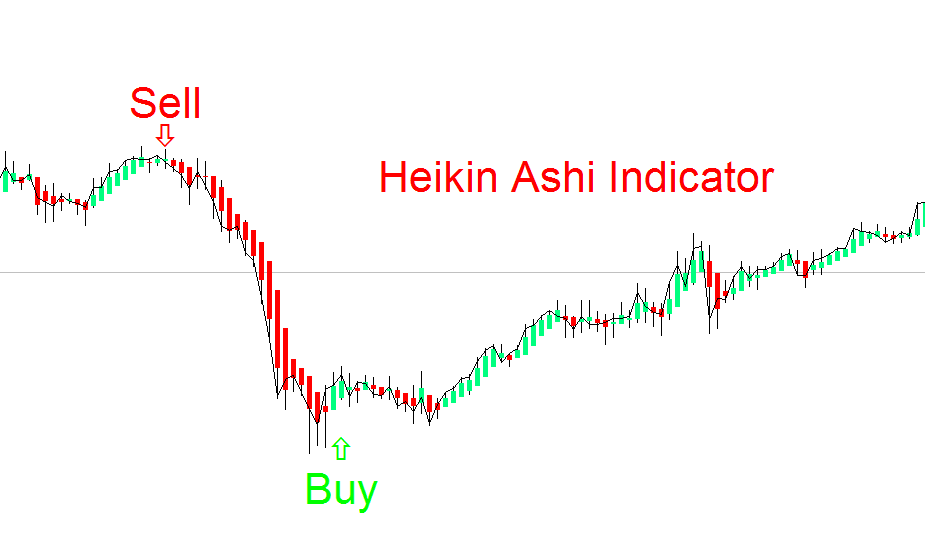
Heikin ashi indicator signals
Buy signal
A buy signal is generated when the color of candlesticks changes from red to green. And you have to hold the trade-in buy position until a counter-trend reversal happens.
Sell signal
A sell signal is generated when the color of candlesticks changes from green to red. You have to hold the trade-in sell position until a bullish trend reversal occurs.
Conclusion
If you’re in habit of closing your trade before time then you should use the heikin ashi indicator in mt4. Sometimes a minor pullback in the price also generates a false reversal signal. That’s why you should always wait for at least two candlesticks of the same color to confirm a trend reversal.
For better accuracy, always look for a reversal from a good key level on the chart.
Download Indicator