In the world of trading, having the right tools can make all the difference. Technical indicators are indispensable for traders looking to analyze market conditions and make informed decisions. The Distance from Bollinger Bands Indicator for MetaTrader 5 (MT5) is a powerful tool that provides traders with valuable insights into market volatility and potential reversal points. In this article, we’ll explore the Distance from Bollinger Bands Indicator, understand its practical applications, and guide you on how to download and integrate it into your MetaTrader 5 platform for free.
Unveiling the Distance from Bollinger Bands Indicator
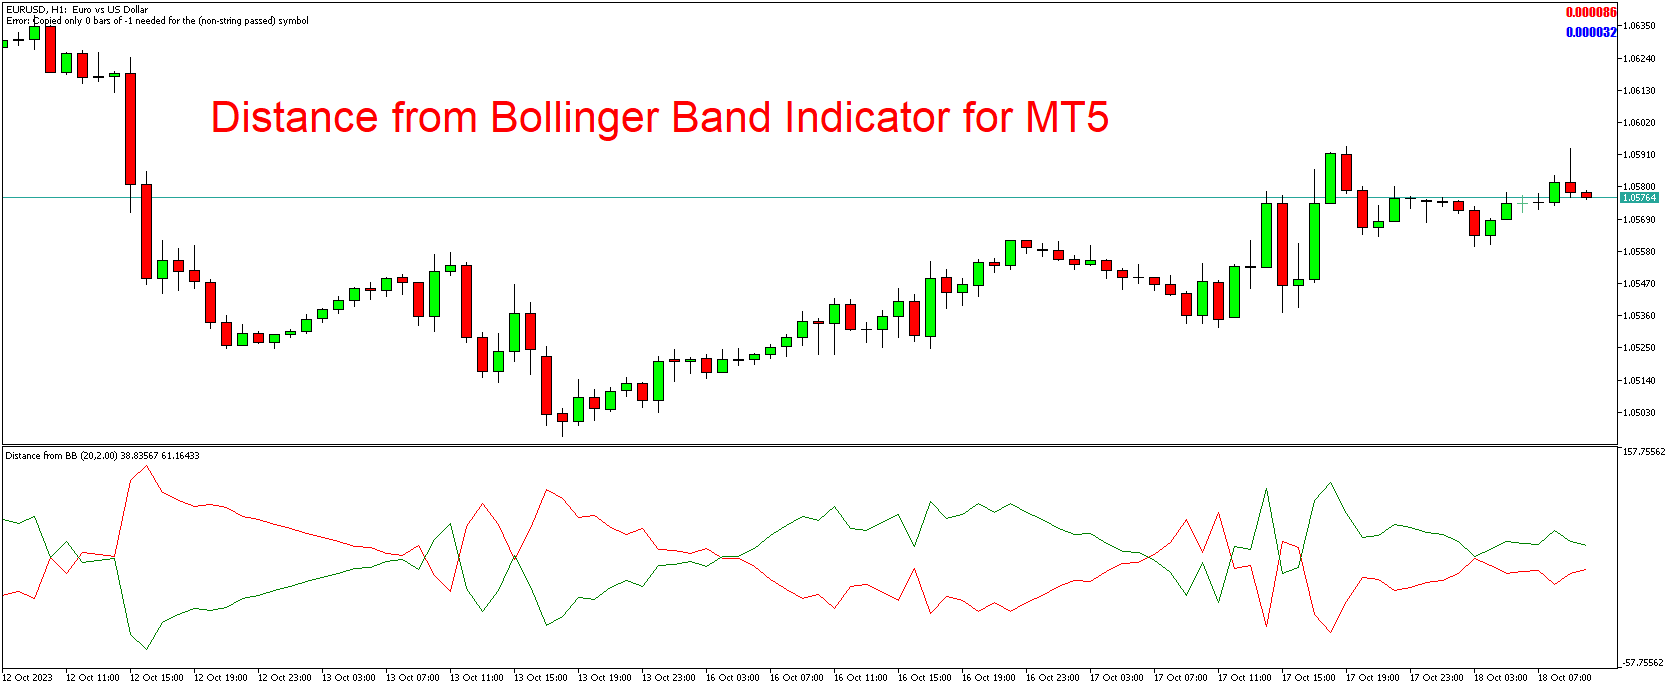
The Distance from Bollinger Bands Indicator is an advanced technical analysis tool designed to offer traders a unique perspective on market dynamics. It is based on the Bollinger Bands, a well-known indicator created by John Bollinger. Bollinger Bands consist of three lines: the middle band, which is a simple moving average, and an upper and lower band, which are derived from standard deviations.
The Distance from Bollinger Bands Indicator takes the concept of Bollinger Bands and simplifies it into a single line that represents the distance between the price and the upper or lower Bollinger Band. This distance serves as a critical tool in identifying market volatility and potential reversals.
Applications of the Distance from Bollinger Bands Indicator
- Volatility Assessment: The primary application of the Distance from Bollinger Bands Indicator is to assess market volatility. When the indicator shows a larger distance from the upper or lower band, it suggests higher volatility, while a smaller distance indicates lower volatility.
- Overbought and Oversold Conditions: Traders often use this indicator to identify overbought and oversold conditions. When the indicator approaches extreme values, it may signal that the market is overextended and due for a reversal or correction.
- Trend Reversal Points: The Distance from Bollinger Bands Indicator can help traders identify potential trend reversal points. When the indicator changes direction and crosses certain thresholds, it can serve as an early signal of a potential trend reversal.
- Confirmation of Trading Signals: Traders often use this indicator to confirm trading signals generated by other technical indicators or their trading strategy. When the indicator aligns with other signals, it provides added confidence in the decision-making process.
How to Download the Distance from Bollinger Bands Indicator for MT5
The Distance from Bollinger Bands Indicator is available for free on the MetaTrader 5 (MT5) platform. Here’s a step-by-step guide on how to download and install it:
- Access Your MetaTrader 5 Platform: Make sure you have the MetaTrader 5 platform installed on your computer or mobile device.
- Log In or Create an Account: If you don’t have a MetaTrader 5 account, create one or log in with your existing account details.
- Open the Navigator Window: In MetaTrader 5, locate the Navigator window, typically situated on the left side of the platform.
- Select ‘Indicators:’ Within the Navigator window, you’ll find a category labeled ‘Indicators.’ Click on it.
- Search for the Distance from Bollinger Bands Indicator: In the Indicators section, search for the Distance from Bollinger Bands Indicator. Once you find it, double-click on it.
- Configure the Indicator: After double-clicking, you can customize the indicator settings according to your preferences. Click ‘OK’ to apply these settings to your chart.
- Apply the Indicator to Your Chart: To use the indicator, drag and drop the Distance from Bollinger Bands Indicator onto your trading chart.
With the Distance from Bollinger Bands Indicator now seamlessly integrated into your MetaTrader 5 platform, you have a powerful tool at your disposal to assess market volatility and potential reversal points.
Conclusion
The Distance from Bollinger Bands Indicator is a valuable addition to any trader’s technical analysis toolkit. Its ability to assess volatility, identify overbought or oversold conditions, pinpoint potential reversal points, and confirm trading signals makes it a versatile tool for traders seeking insights into market conditions.
Download indicator