Volatility plays a crucial role in the financial markets, influencing price movements and presenting opportunities for traders to profit. To effectively navigate the markets, traders rely on technical indicators that can provide insights into market volatility. The Volatility Indicator, available for free download on the MT5 platform, is one such tool designed to measure and display market volatility. In this article, we will explore the Volatility Indicator, understand its key features, and guide traders on how to download and use it.
Introduction
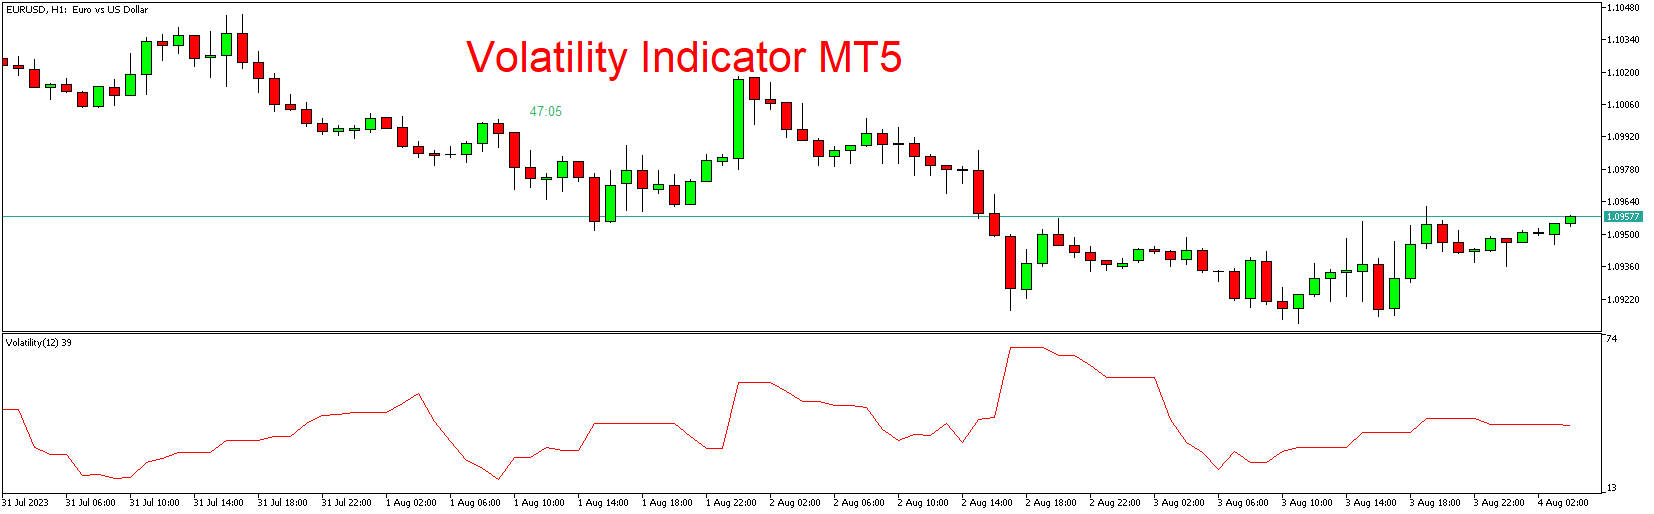
The Volatility Indicator is a popular technical analysis tool used to assess the level of price volatility in the financial markets. It calculates and displays the volatility as a separate line on the price chart, providing traders with valuable information about the market’s turbulence. By understanding volatility, traders can adapt their strategies accordingly and make well-informed trading decisions.
Understanding the Volatility Indicator
The Volatility Indicator operates on the principle that higher volatility often corresponds to wider price fluctuations, while lower volatility indicates more stable price movements. It is essential for traders to identify periods of high volatility, as they may indicate potential trend changes, breakouts, or reversals. Conversely, low volatility periods may signify consolidation or range-bound trading conditions.
The Volatility Indicator uses historical price data to calculate volatility. It may incorporate various algorithms, such as the Average True Range (ATR) or Standard Deviation, to derive volatility values. The resulting volatility line can be interpreted in conjunction with other technical tools to confirm trading signals.
Key Features of the Volatility Indicator for MT5
- Volatility Calculation: The indicator employs specific mathematical formulas, such as ATR or Standard Deviation, to compute the level of volatility based on historical price data.
- Volatility Line: The indicator plots a separate line on the price chart, representing the volatility level at each point.
- Customizable Parameters: Traders can adjust the indicator’s settings, such as the period for volatility calculation, to suit their trading preferences and timeframes.
- Signal Confirmation: The Volatility Indicator can be used alongside other technical indicators to confirm trading signals and assess the strength of price movements.
How to Download the Volatility Indicator for MT5
The Volatility Indicator is available for free download on various websites and trading forums. To install the indicator on your MT5 trading platform, follow these simple steps:
- Locate a reputable website or forum that offers free custom MT5 indicators.
- Search for the Volatility Indicator or similar volatility-based indicators.
- Download the indicator file to your computer.
- Launch your MT5 trading platform.
- Click on the “File” menu in the top-left corner and select “Open Data Folder.”
- Find the “MQL5” directory and locate the “Indicators” folder.
- Copy the downloaded indicator file into the “Indicators” folder.
- Restart your MT5 platform.
- The Volatility Indicator will now be available in the “Navigator” window, under the “Indicators” section.
How to Use the Volatility Indicator
Once you have successfully installed the Volatility Indicator on your MT5 platform, follow these steps to use it effectively:
- Open the desired price chart for the financial instrument you wish to analyze.
- Drag and drop the Volatility Indicator from the “Navigator” window onto the price chart.
- Adjust the indicator’s parameters, such as the period for volatility calculation, to match your trading preferences.
- Analyze the volatility line on the chart. Higher values indicate periods of increased volatility, while lower values suggest reduced volatility.
- Combine the information from the Volatility Indicator with other technical tools, such as trend indicators or oscillators, to identify potential trading opportunities.
Conclusion
The Volatility Indicator is a valuable tool for traders seeking to gauge market volatility and adapt their trading strategies accordingly. By calculating and displaying the level of volatility on the price chart, the indicator provides crucial insights into price movements and potential trend changes. Traders can use this information to make well-informed decisions and manage risk effectively.
Download indicator