In the world of trading, accurately assessing market volatility is essential for making well-informed decisions. Traders often rely on various technical indicators to gauge price fluctuations, identify trends, and set risk management levels. The HL Bands Indicator for MetaTrader 5 (MT5) is a powerful tool designed to enhance traders’ understanding of market volatility. In this article, we will explore the HL Bands Indicator, its features, and how it empowers traders to navigate volatility with precision. The best part is that it’s available for free, making it accessible to traders of all levels.
Introduction
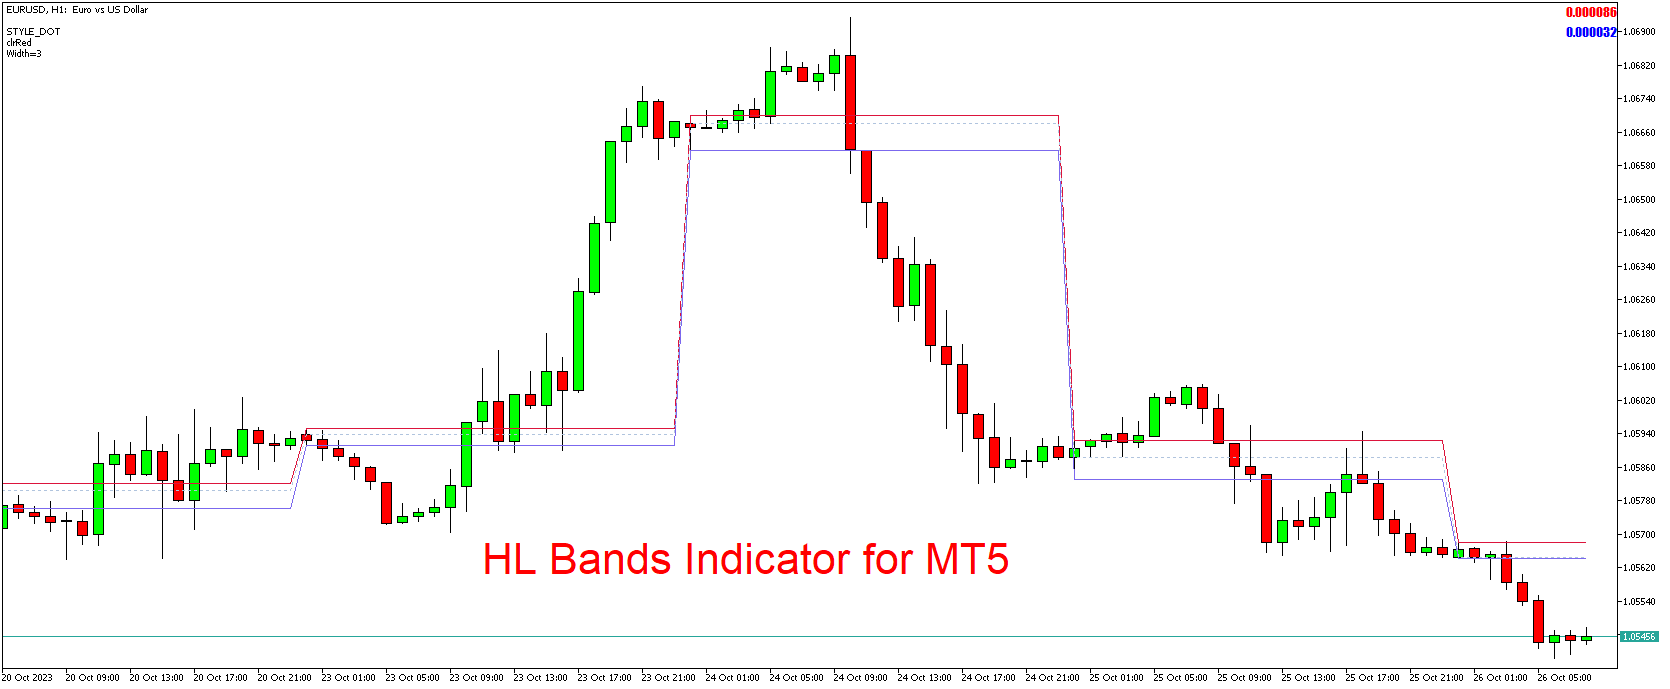
The HL Bands Indicator is a specialized technical analysis tool created exclusively for the MT5 trading platform. It takes its name from its primary function – plotting bands on the price chart based on high and low price data. These bands help traders assess the range of price movements and the potential for volatility in the market.
The Significance of Assessing Volatility
Before diving into the features of the HL Bands Indicator, it’s crucial to understand why assessing volatility is essential in trading. Volatility measures the magnitude of price fluctuations in a market. Traders need to know how volatile a market is to set appropriate risk management levels, identify trend strength, and plan their trades effectively.
Features of the HL Bands Indicator
1. Bollinger Band-Like Bands:
The primary feature of the HL Bands Indicator is its ability to create bands on the price chart, similar to Bollinger Bands. These bands are based on high and low price data, and they offer a visual representation of potential support and resistance levels, as well as price range expectations.
2. Customization Options:
The indicator is highly customizable, allowing traders to adjust its parameters to align with their specific trading strategies and preferences. This includes modifying the sensitivity of the indicator and other settings to fine-tune its performance.
3. User-Friendly Interface:
The HL Bands Indicator maintains a user-friendly interface that ensures traders can easily interpret the information. The bands are presented clearly on the price chart, making it accessible to traders of all experience levels.
4. Real-Time Updates:
For traders who prefer real-time information, the indicator can provide updates as market conditions change. This ensures that traders have access to the most current data on market volatility.
Applying the HL Bands Indicator
Traders can utilize the HL Bands Indicator in various ways:
- Setting Stop-Loss and Take-Profit Levels: The bands can help traders determine appropriate stop-loss and take-profit levels based on price range expectations.
- Assessing Market Volatility: By observing the width of the bands, traders can gauge the level of volatility in the market, enabling them to make informed decisions about position sizing and risk management.
- Trend Strength Analysis: The indicator can assist traders in identifying trend strength based on the bands’ slope and width.
- Entry and Exit Points: Traders can use the bands to identify potential entry and exit points based on support and resistance levels.
Conclusion
The HL Bands Indicator for MT5 is a valuable addition to any trader’s toolkit. Its ability to visually represent potential support and resistance levels and assess market volatility empowers traders to make more precise trading decisions. The fact that this indicator is available for free ensures accessibility to traders at all levels.
Download indicator