In the world of trading, accurate analysis and the ability to visualize market data are essential for making informed decisions. Traders often rely on technical indicators to gain insights into market trends, support and resistance levels, and other critical aspects of price action. The Draw Histogram Indicator for MetaTrader 5 (MT5) is a valuable tool that enhances market analysis by providing visual clarity. In this article, we will explore this indicator, its features, and how it empowers traders to make more precise trading decisions. The best part is that it’s available for free, offering accessibility to traders of all levels.
Introduction
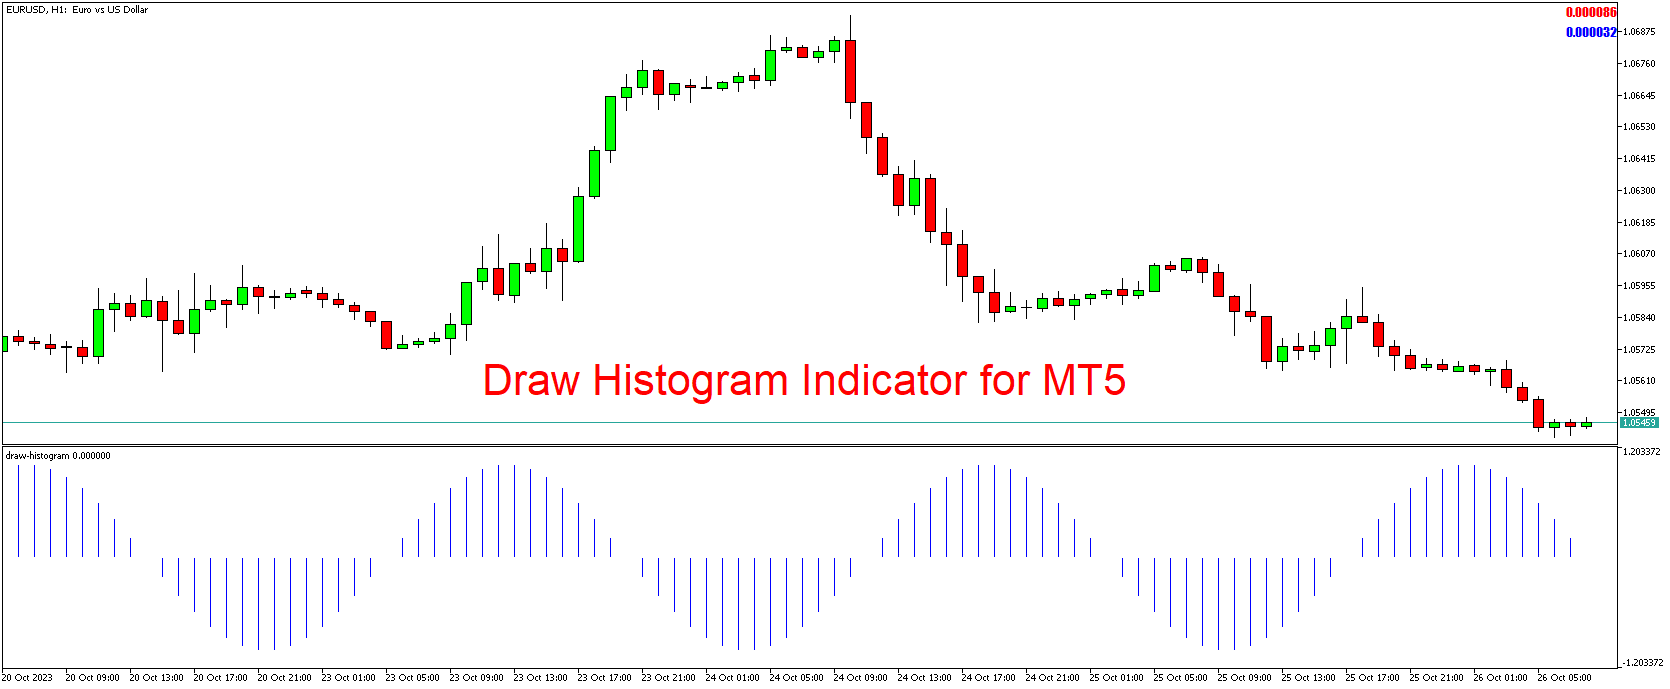
The Draw Histogram Indicator is a specialized technical analysis tool designed specifically for the MT5 platform. It’s named after its primary function – creating histograms or bar charts on the price chart to visually represent various market data. This visual representation can help traders gain a deeper understanding of price movements and support and resistance levels.
The Importance of Visual Clarity in Trading
Before we delve into the features of the Draw Histogram Indicator, let’s emphasize the significance of visual clarity in trading. Traders need to quickly and accurately interpret market data, and visual representations like histograms can simplify the process. They provide an intuitive way to spot trends, patterns, and significant price levels.
Features of the Draw Histogram Indicator
1. Visual Representation:
The primary feature of this indicator is its ability to visually represent market data on the price chart. It can create histograms that represent various aspects of price action, such as support and resistance levels or specific market conditions.
2. Customization Options:
The indicator is highly customizable, allowing traders to adjust its parameters to suit their specific trading strategies and preferences. They can modify the appearance of the histograms to align with their visual preferences.
3. User-Friendly Interface:
The Draw Histogram Indicator maintains a user-friendly interface, ensuring that traders can easily interpret the information. It’s designed to be accessible to traders of all experience levels.
4. Real-Time Updates:
For traders who prefer real-time information, the indicator can provide updates as market conditions change. This ensures that traders have access to the most current data.
Applying the Draw Histogram Indicator
Traders can use the Draw Histogram Indicator in various ways:
- Support and Resistance Identification: The indicator can be used to visually represent support and resistance levels, helping traders make more precise decisions about entry and exit points.
- Market Condition Visualization: Traders can use histograms to represent specific market conditions, such as overbought or oversold conditions, enabling them to spot potential reversals or trend continuations.
- Pattern Recognition: The visual representation of price data can aid in pattern recognition, helping traders identify chart patterns like flags, triangles, or head and shoulders formations.
- Risk Management: Traders can incorporate the indicator into their risk management strategies, using visual cues to set stop-loss and take-profit levels.
Conclusion
The Draw Histogram Indicator for MT5 is a valuable addition to any trader’s toolkit. Its ability to provide visual clarity to market analysis by creating histograms empowers traders to gain a deeper understanding of price action, support and resistance levels, and various market conditions. The fact that this indicator is available for free ensures accessibility to traders at all levels.
Download indicator