Introduction
In the realm of forex trading, technical indicators serve as essential tools to assess market conditions and inform trading decisions. The Historical Volatility (HV) Indicator, designed for the MetaTrader 5 (MT5) platform, is a powerful instrument that provides insights into market volatility by analyzing historical price movements. This article aims to provide a comprehensive guide to understanding, utilizing, and acquiring the Historical Volatility Indicator for free.
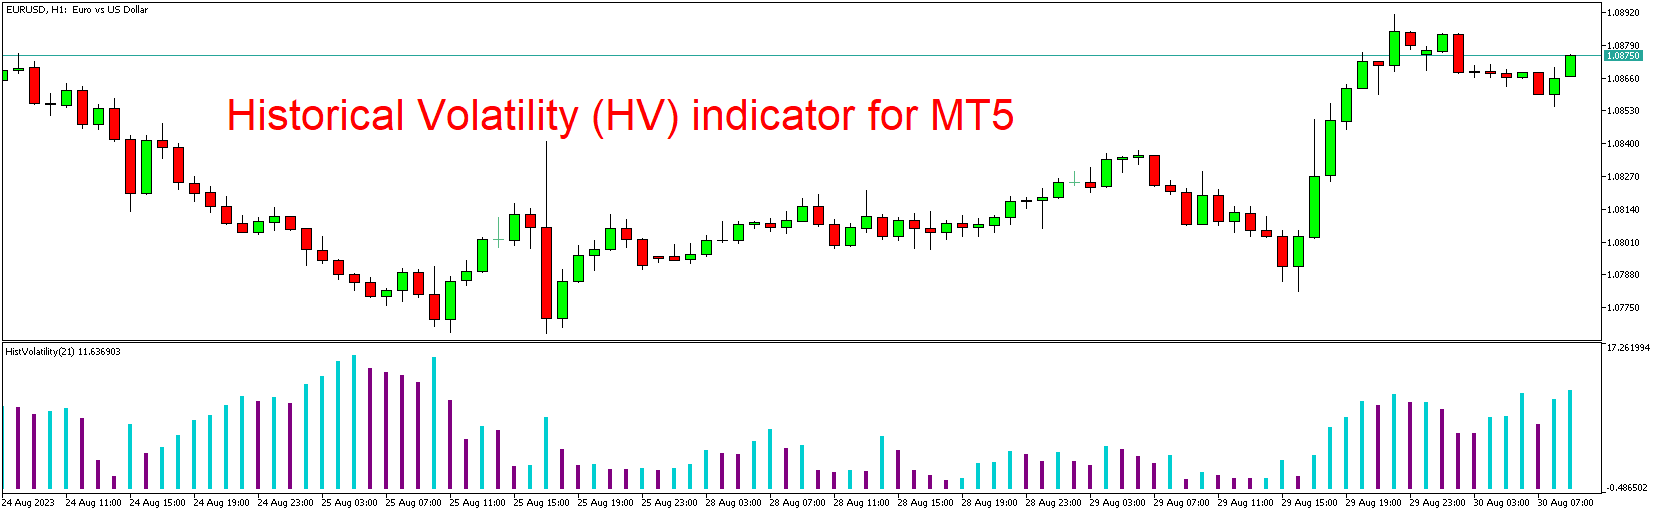
Understanding the Historical Volatility (HV) Indicator
The Historical Volatility Indicator measures the extent of price fluctuations in the past to gauge market volatility. It helps traders assess the potential risk and opportunities in the market by providing a statistical perspective on historical price movements.
Key Features of the Historical Volatility (HV) Indicator:
- Calculation Method: The HV Indicator calculates the standard deviation of price changes over a specific period. This standard deviation is often expressed as a percentage, representing the historical volatility.
- Volatility Gauge: The indicator’s value reflects the market’s volatility during the chosen time frame. Higher HV values suggest increased price fluctuations, indicating higher volatility.
Interpreting the Historical Volatility (HV) Indicator:
- Volatility Trends: Monitoring the Historical Volatility Indicator allows traders to identify periods of heightened or subdued volatility. Increased HV readings suggest turbulent market conditions, while lower HV readings indicate calmer markets.
- Comparison: By comparing current HV values to historical ones, traders can assess whether the current volatility is in line with past market behavior or if an anomaly is present.
Applying the Historical Volatility (HV) Indicator on MT5:
- Downloading the Indicator: Initiate the process by searching for the “Historical Volatility Indicator for MT5” on reliable trading platforms or forums. Download the indicator file and save it to a location on your computer.
- Installing the Indicator: Launch your MetaTrader 5 platform and access the “File” menu. Choose “Open Data Folder” to navigate to the root directory. Locate the “MQL5” folder and then the “Indicators” subfolder. Copy and paste the downloaded Historical Volatility Indicator file into this directory. Restart MT5 to load the indicator.
- Applying the Indicator: After MT5 restarts, go to the “Navigator” window and locate the Historical Volatility Indicator under “Indicators.” Drag and drop the indicator onto your preferred chart. A settings window will appear, allowing you to customize parameters such as the calculation period.
- Interpreting Signals: Utilize the Historical Volatility readings to assess the current market environment and potential risks. Combine this information with other technical and fundamental analysis tools for well-rounded trading decisions. Maintain proper risk management strategies.
Conclusion:
The Historical Volatility Indicator for MetaTrader 5 equips traders with insights into market volatility, aiding them in gauging risk and making informed trading decisions. By understanding its features and interpretation methods, traders can seamlessly integrate the Historical Volatility Indicator into their trading strategies to potentially enhance their risk management and overall trading success. However, remember that no single indicator ensures success; effective trading requires a holistic approach that includes multiple forms of analysis, disciplined risk management, and continuous learning.
Download indicator