The Triangular Moving Average (TMA) Centered Bands Indicator for MetaTrader 5 (MT5) is a versatile technical analysis tool that provides a unique perspective on market trends. This indicator presents the TMA line and creates two ‘bands’ around it, essentially forming a price channel that can be used to identify potential trading opportunities.
The TMA Centered Bands Indicator is often used to gauge volatility and spot overbought or oversold conditions, helping traders make more informed decisions and sharpen their trading strategies.
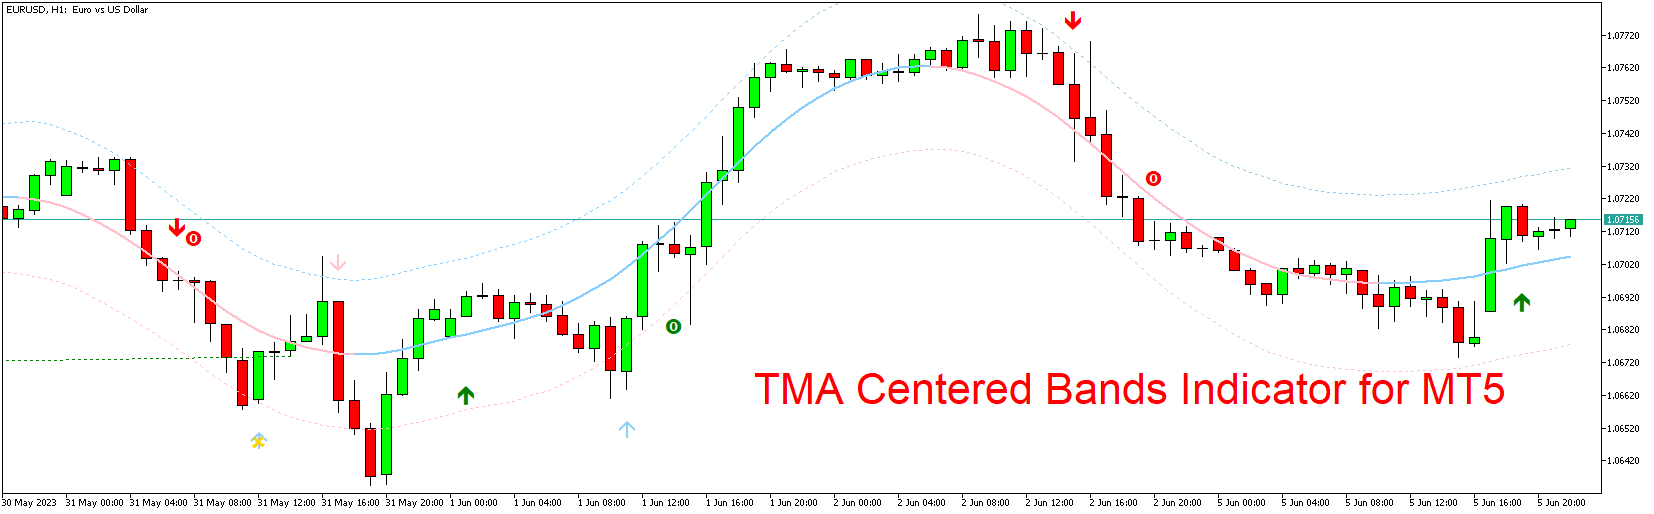
Working of the TMA Centered Bands Indicator in MT5
The TMA Centered Bands Indicator plots three lines on the price chart: the TMA line in the center, an upper band, and a lower band. These bands are typically plotted at a certain number of standard deviations away from the TMA line, thereby adjusting for market volatility.
When the price touches or crosses the upper band, it indicates that the asset may be overbought, signaling a potential selling opportunity. Conversely, if the price touches or crosses the lower band, it suggests the asset may be oversold, pointing to a possible buying opportunity.
Delving Deeper into the TMA Centered Bands Indicator for MT5
Customizability
The TMA Centered Bands Indicator allows users to adjust its settings according to their needs. Traders can modify parameters such as the TMA period and the standard deviation multiplier for the bands, allowing them to tailor the indicator to align with their unique trading strategies.
Combination with Other Indicators
To enhance its effectiveness, the TMA Centered Bands Indicator can be used in conjunction with other technical analysis tools. For instance, momentum indicators like the Relative Strength Index (RSI) or Stochastic oscillator can help confirm overbought or oversold signals generated by the TMA Centered Bands.
Key Points
- Identifying Market Conditions: The TMA Centered Bands Indicator excels in identifying potential overbought and oversold conditions, providing traders with timely trading signals.
- Adjusting for Volatility: By calculating the bands based on standard deviations from the TMA line, the indicator adjusts for changes in market volatility.
- Customizable Parameters: The adjustable parameters of the TMA Centered Bands Indicator enable traders to customize the tool to suit their individual trading strategies.
- Versatility: The indicator can be applied across various asset classes, including Forex, commodities, stocks, and cryptocurrencies.
Conclusion
The TMA Centered Bands Indicator for MT5 is a powerful and versatile tool that can enhance a trader’s technical analysis toolbox. By identifying overbought and oversold conditions and adjusting for market volatility, this indicator offers valuable insights that can help traders optimize their strategies and make more informed decisions.
Download indicator