Introduction
The Triple Exponential Moving Average (TEMA) Indicator is a sophisticated technical analysis tool designed to help traders follow trends more effectively and make more informed decisions in the market. This powerful MetaTrader 5 (MT5) indicator provides valuable insights into market momentum and trend direction, allowing traders to enter and exit trades with increased precision. In this comprehensive guide, we will discuss the TEMA Indicator’s concept, its workings, interpretation, and effective trading strategies. Plus, we’ll provide a FREE DOWNLOAD for the MT5 platform.
What is the TEMA Indicator?
The Triple Exponential Moving Average (TEMA) Indicator, developed by Patrick Mulloy, is an MT5 technical analysis tool designed to provide a smoother and more accurate representation of price trends. The TEMA Indicator calculates three Exponential Moving Averages (EMAs) and their respective differences to create a single line that closely follows price movements while reducing noise and lag.
How Does the TEMA Indicator Work?
The TEMA Indicator calculates three EMAs of the closing price for a specified period (usually 14 days) and subtracts their respective differences to create a single line that closely follows price movements. The formula for the TEMA Indicator is as follows:
TEMA = (3 * EMA1) – (3 * EMA2) + EMA3
Where EMA1 is the first EMA, EMA2 is the second EMA, and EMA3 is the third EMA.
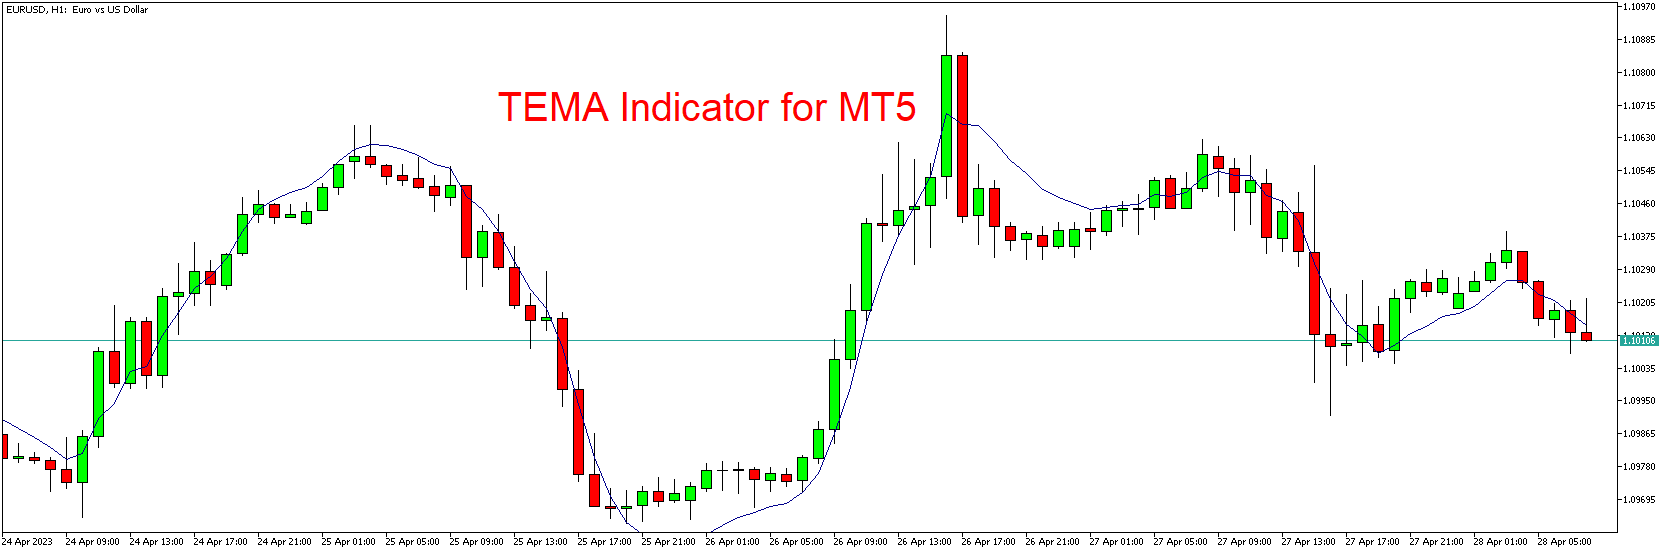
The indicator displays the information as a single line that oscillates around the price chart, providing a smoother and more accurate representation of price trends.
Interpreting the TEMA Indicator
The TEMA Indicator provides valuable insights into market momentum and trend direction. Here’s how to interpret the indicator:
- Trend Direction: When the TEMA line is rising, it indicates an upward trend, signaling a potential buying opportunity. Conversely, when the TEMA line is falling, it suggests a downward trend, signaling a potential selling opportunity.
- Crossovers: When the price crosses above the TEMA line, it indicates a potential buying opportunity, while a cross below the TEMA line suggests a potential selling opportunity.
TEMA Indicator Trading Strategies
Trend Following
Traders can use the TEMA Indicator to follow price trends more effectively. When the TEMA line is rising, traders can enter long positions, while a falling TEMA line can signal short positions.
Crossover Strategy
Using the TEMA Indicator, traders can develop a crossover strategy where they enter trades when the price crosses above or below the TEMA line. A cross above the TEMA line signals a potential buying opportunity, while a cross below the TEMA line suggests a potential selling opportunity.
Combining TEMA Indicator with Other Indicators
For enhanced reliability, traders can use the TEMA Indicator alongside other technical analysis tools, such as support and resistance levels, trendlines, or momentum indicators.
Download indicatorConclusion
The TEMA Indicator is a powerful technical analysis tool designed for traders seeking a smoother and more accurate representation of price trends. By understanding its concept, workings, and interpretation, traders can leverage this MT5 indicator to make more informed decisions in the market. Remember to combine the TEMA Indicator with other technical analysis tools and fundamental factors to develop a well-rounded trading strategy. Download the FREE TEMA Indicator for MT5 to improve your trend following experience today.