Introduction
On Balance Volume Indicator (OBV) is a technical momentum indicator that links volume flow to price change. Joseph Granville first developed the idea in his book “Granville’s New Key to Stock Market Profits” in 1963.
Granville considered that volume to be the leading market driver. He created OBV to forecast when significant market movements would be triggered in response to changes in volume.
In his book, he described the prediction that OBV made by telling them as “a spring being wound tightly.” He believed that if the volume is increased dramatically but without a significant shift in the value of the stock, then the price will rise or fall.

Key Functions of OBV indicator
- OBV provides a snapshot of crowd sentiment, which can help us predict a bullish or bearish outcome.
- Comparing the relative movement of price bars with OBV provides better actionable information. When compared with red or green volume histograms typically located in the middle of the price chart.
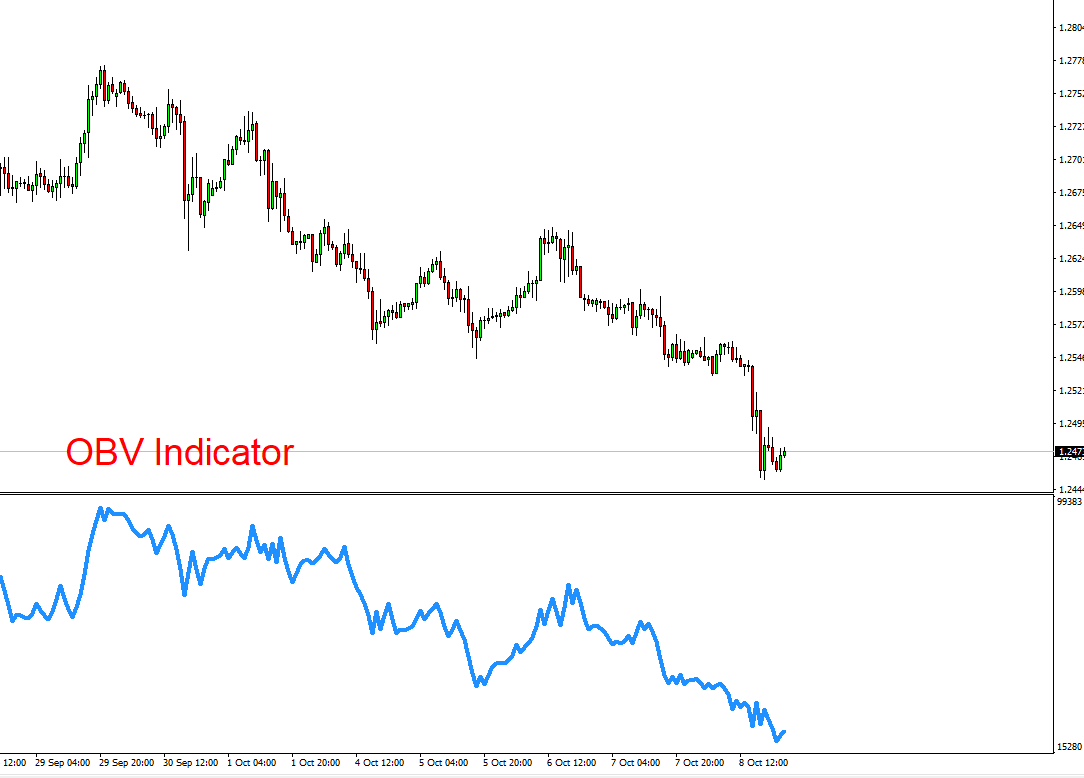
Trends with OBV Indicator
The indicator can be positive or negative, oscillating around the zero-value line and between positive and negative values.
On-balance volume has a positive value when the price today is higher than the previous closing price, while a negative value appears if today’s price is lower than the last closing price.
Rising
The trend rises when each new peak is higher than the previous one, and each new trough is greater than the previous one.
Falling Trend
On Balance, Volume is in a falling trend when the volume is trending downwards. Every consecutive peak has a lower value than the prior peak, and every subsequent trough is less than its predecessor.
Doubtful trend
It is doubtful when OBV is moving sideways and is not making successive highs and lows.
Breaking of OBV indicator trend
OBV trend can be a break in two ways:
- It can be broken when the trend changes from a rising trend to a falling trend, or from a falling trend to a rising trend.
- OBV trend may be broken if the trend shifts to a doubtful trend and is not confirmed for more than three days.
Trading with OBV

Changing of rising or falling trend results in a breakout in OBV. Since these breakouts precede the price breakouts, which helps investors to make decisions
Buying
Investors should buy long-on while upside breakouts.
Selling
If OBV makes a downside breakout, investors should sell short.
Conclusion
If the volume or a volume proxy indicator is rising while the price is declining, some traders may interpret this divergence as a sign that price will shortly follow. Similarly, traders may analyze price movement but low volume as a sign that the market is preparing to consolidate.
When pricing changes up or down, OBV uses this concept by keeping an ongoing tally of volume. It adds up the volume on up days and deducts the volume on down days.
OBV can be used in any system – trend-following/momentum or price reversal. Traders who are trend followers may use the OBV’s signals with indicators that help identify the trend.
Those who prefer to identify potential turning points in the market might combine the OBV with price reversal indicators (e.g., certain types of oscillators, moving average crossover strategies).
Don’t also forget to check out Swing Index indicator
Download