Introduction
The Momentum Indicator is a popular technical analysis tool used by traders to measure the rate of change of prices over a specified period. The indicator can be used to identify trend direction, potential trend reversals, and overbought or oversold conditions in the market. In this comprehensive guide, we will discuss the concept, working, interpretation, and how to trade with the Momentum Indicator. Plus, we’ll provide a FREE DOWNLOAD link for the MT5 platform.
What is the Momentum Indicator?
The Momentum Indicator is a technical analysis tool that measures the rate of change of prices over a specified period. The indicator is based on the concept that prices tend to move in trends, and the momentum of those trends can be measured by tracking the rate of change of prices. The Momentum Indicator is calculated by subtracting the closing price of a specified period from the closing price of a previous period and then plotting the results on a chart.
How Does the Momentum Indicator Work?
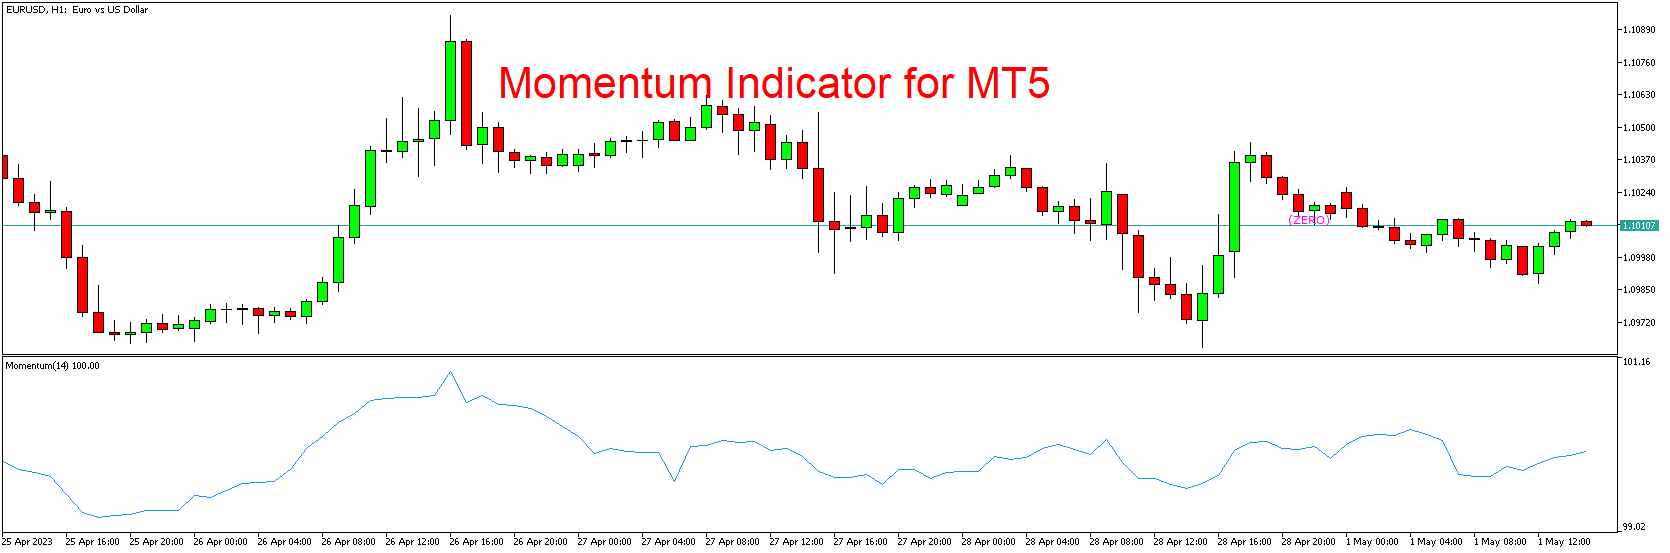
The Momentum Indicator is calculated by subtracting the closing price of a specified period from the closing price of a previous period. The indicator is then plotted on a chart, usually as a line that oscillates around a zero line. If the Momentum Indicator is above the zero line, it indicates that prices are increasing, and if it is below the zero line, it indicates that prices are decreasing.
The Momentum Indicator can be calculated over any period, but the most common periods are 12 and 14. Traders can adjust the period to suit their trading style and preferences.
Interpreting the Momentum Indicator
Traders can use the Momentum Indicator to make informed trading decisions based on the following interpretations:
- Trend Direction: Traders can use the Momentum Indicator to identify trend direction in the market. If the Momentum Indicator is above the zero line, it indicates an uptrend, and if it is below the zero line, it indicates a downtrend.
- Overbought/Oversold Conditions: Traders can use the Momentum Indicator to identify overbought or oversold conditions in the market. If the Momentum Indicator is above a certain level, such as 100, it indicates that prices are overbought and may be due for a correction. Conversely, if the Momentum Indicator is below a certain level, such as -100, it indicates that prices are oversold and may be due for a rebound.
- Divergence: Traders can also use the Momentum Indicator to identify divergence between the indicator and the price action. If the Momentum Indicator is moving in the opposite direction of the price action, it indicates a potential trend reversal.
Trading with the Momentum Indicator
Here are some tips for trading with the Momentum Indicator:
- Consider entering a long (buy) position when the Momentum Indicator crosses above the zero line and a short (sell) position when it crosses below the zero line.
- Use the Momentum Indicator to identify potential overbought or oversold conditions in the market. Look for the Momentum Indicator to move above or below a certain level, such as 100 or -100, indicating a potential reversal.
- Look for divergence between the Momentum Indicator and the price action to identify potential trend reversals.
Conclusion
The Momentum Indicator is a powerful technical analysis tool that helps traders identify trend direction, potential trend reversals, and overbought or oversold conditions in the market. By using the Momentum Indicator in combination with other technical analysis tools, traders can increase the accuracy and reliability of their trading signals.
Download indicator