Introduction
The Vortex Indicator for MT5 is a powerful technical analysis tool designed to help traders identify the direction and strength of a market trend. Developed by Etienne Botes and Douglas Siepman, this indicator utilizes the concepts of positive and negative directional movement to provide insights into the prevailing market trend. By incorporating the Vortex Indicator into your trading strategy, you can gain a deeper understanding of market dynamics and make more informed trading decisions. In this article, we will explore the features, working principles, and benefits of the Vortex Indicator for MT5, and provide a free download link for traders to access this tool and enhance their trading experience.
Features of the Vortex Indicator
The Vortex Indicator offers several key features that make it a valuable tool for traders:
- Directional Movement: The indicator measures both positive and negative directional movement, allowing traders to assess the strength and direction of the current trend. Positive directional movement indicates upward price movement, while negative directional movement reflects downward price movement.
- Trend Confirmation: By comparing positive and negative directional movement, the Vortex Indicator confirms the presence of a trend. Traders can use this information to validate the strength of an existing trend or identify potential trend reversals.
- Customizable Settings: Traders can customize the indicator’s parameters to suit their trading preferences. They can adjust the lookback periods and smoothing factors to adapt the indicator to different timeframes and market conditions.
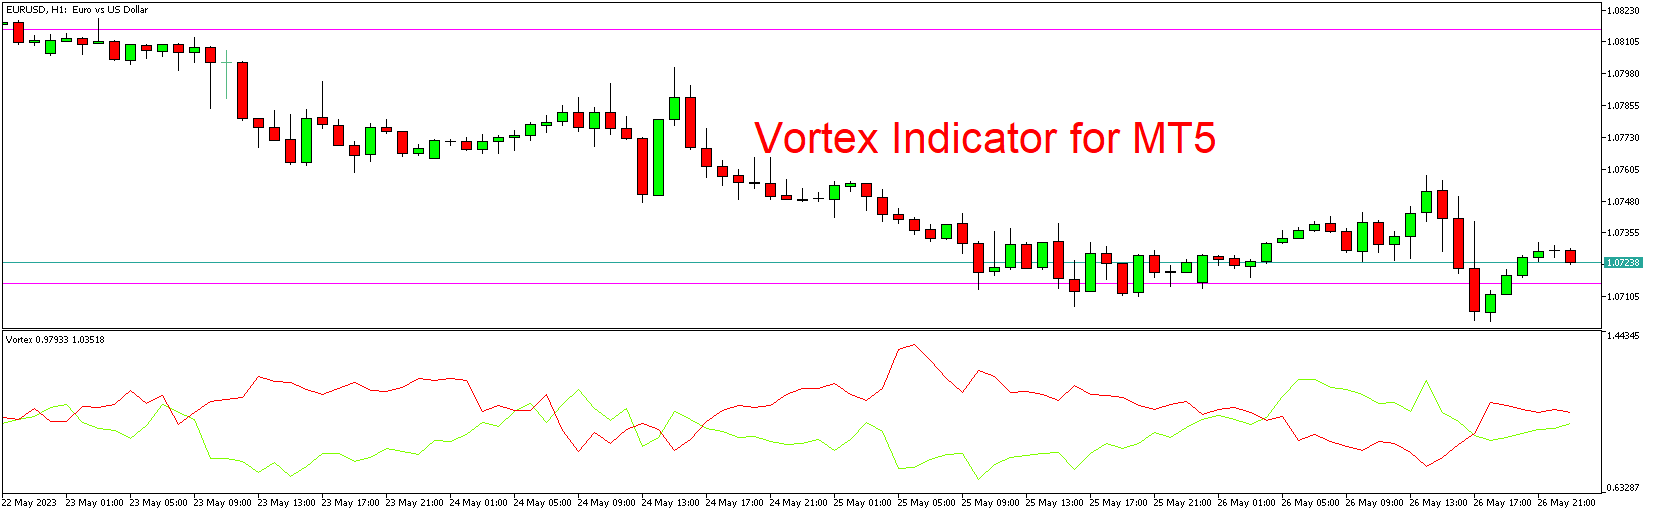
- Visual Representation: The Vortex Indicator plots two lines on the price chart – the positive vortex line (VI+) and the negative vortex line (VI-). These lines visually represent the strength and direction of the trend, making it easy for traders to interpret the information.
Working Principles of the Vortex Indicator
The Vortex Indicator calculates the positive and negative directional movement by comparing the current high and low prices with the previous high and low prices. Here’s how it works:
- True Range Calculation: The indicator calculates the true range, which represents the greatest of the following values: the current high minus the current low, the absolute value of the current high minus the previous close, and the absolute value of the current low minus the previous close.
- Positive and Negative Movement Calculation: The indicator compares the current high and low prices with the previous high and low prices to determine positive and negative movement. If the current high is greater than the previous high, it indicates positive movement. If the current low is less than the previous low, it indicates negative movement.
- Accumulation of Directional Movement: The Vortex Indicator accumulates the positive and negative directional movement over a specified lookback period.
- Calculation of Vortex Lines: The positive vortex line (VI+) is calculated by dividing the sum of positive movement over the lookback period by the sum of the true range over the same period. The negative vortex line (VI-) is calculated similarly using negative movement.
- Plotting the Vortex Lines: The VI+ and VI- lines are plotted on the price chart, providing a visual representation of the trend strength and direction. When the VI+ line is above the VI- line, it indicates a bullish trend, and when the VI- line is above the VI+ line, it suggests a bearish trend.
Benefits of the Vortex Indicator
- Trend Identification: The Vortex Indicator helps traders identify the prevailing market trend by comparing positive and negative directional movement. This information allows traders to align their strategies with the current trend, increasing the probability of successful trades.
- Trend Confirmation: By measuring the strength of the trend, the Vortex Indicator confirms the robustness of the price movement. Traders can use this confirmation to validate their trading decisions and avoid potential false signals.
- Early Reversal Signals: The Vortex Indicator can also provide early signals of potential trend reversals. When the VI+ line crosses below the VI- line, it may indicate a potential shift from a bullish to a bearish trend, and vice versa. Traders can use these signals to adjust their positions or enter new trades.
- Versatile Application: The Vortex Indicator can be applied to various financial instruments and timeframes, making it suitable for different trading styles. Whether you are a day trader, swing trader, or long-term investor, this indicator can enhance your trend analysis across multiple markets.
Conclusion
The Vortex Indicator for MT5 is a valuable tool for traders seeking to enhance their trend analysis and make more informed trading decisions. By measuring positive and negative directional movement, this indicator provides insights into the strength and direction of the market trend. With customizable settings, visual representation, and the ability to identify potential reversals, the Vortex Indicator offers a comprehensive solution for trend analysis. Download the Vortex Indicator for MT5 using the following link and integrate it into your trading platform to gain a deeper understanding of market trends and improve your trading performance.
Download indicator