The indicator which displays all the news and events that can affect the financial markets along the timestamps of news is called fxr Economic Calendar Indicator.
We all know there are two types of analysis in the financial markets. The first is technical, where traders rely heavily on chart and candlestick patterns. Using the drawing tools available on trading platforms, they forecast the Market.
The second is fundamental analysis, in which the traders look for any news or events from central banks and reserve banks to predict the effect of this news on the currency pair.
Working of FXR Economic Calendar Indicator:
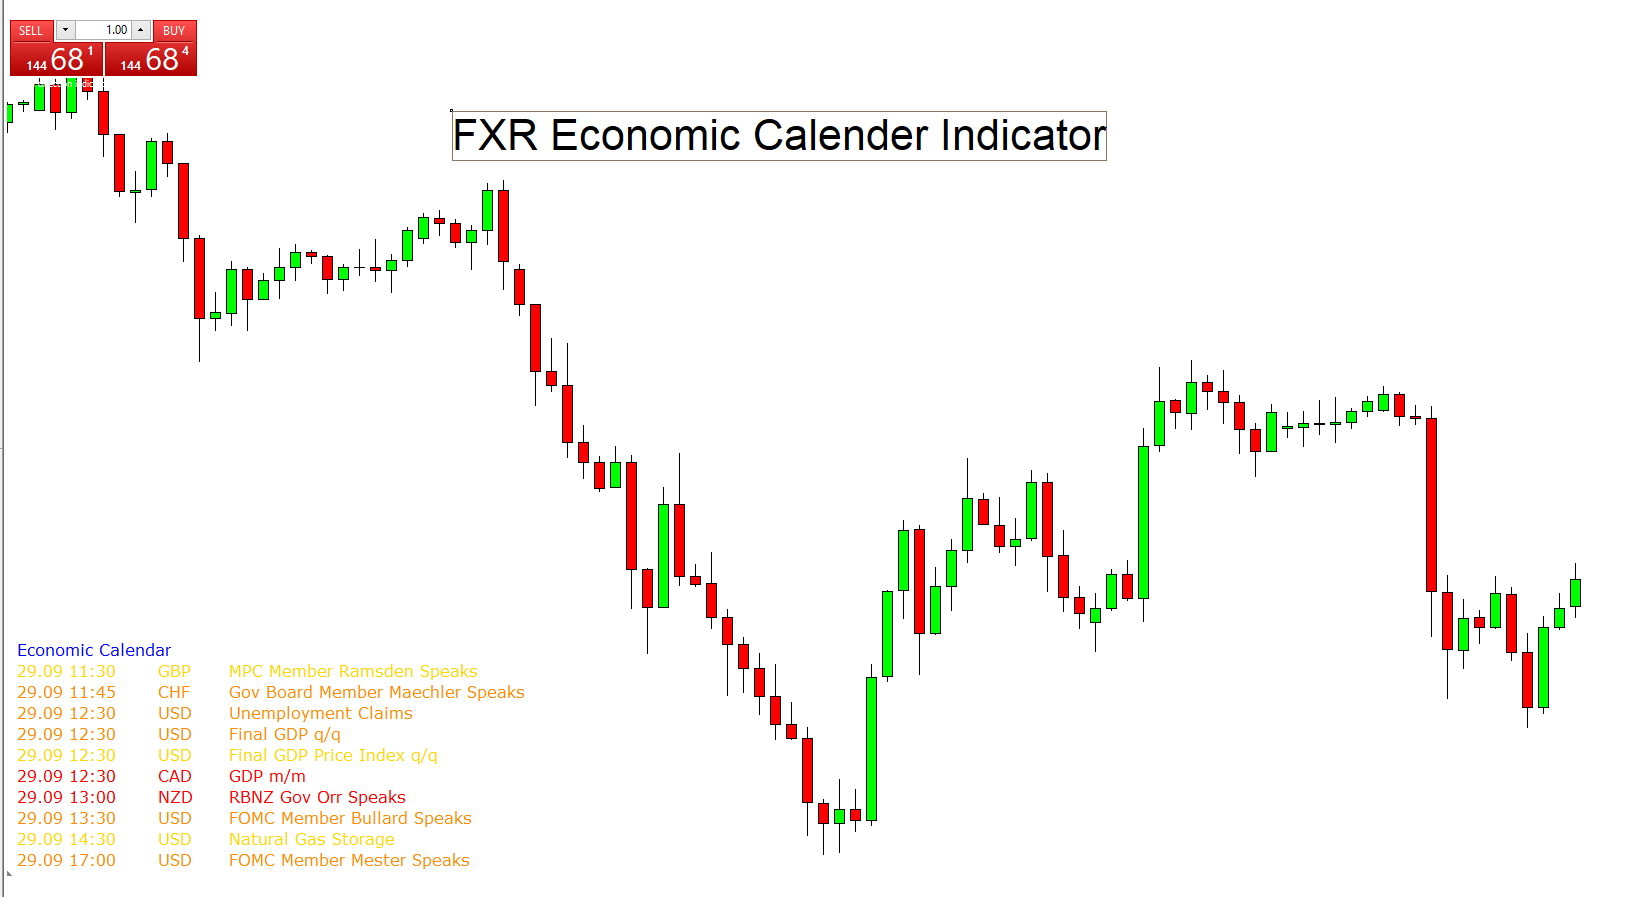
When you apply the indicator to the charts, the indicator will show the news in the form of a chart in a specified corner.

This chart includes the following types of information.
- The timestamp of news
- The Pair that is most like to be affected
- Piece of news.
Along with this data, the indicator also shows the data in three different colours resonating with that news’s impacts on the respective currency pair.
The three colours used are.
- Yellow: This indicates the effect of the news on the pair will be very low or negligible.
- Orange: The orange colour represents that the currency pair will be moderately affected by the new
- Red: This is important because it represents that the currency pair will be highly affected by the news or event.
Trading Strategy for FXR Economic Calendar Indicator:
As discussed in the first paragraph, the FXR indicator gives us news about the currency pair. And during that news event, the volatility in that pair is relatively very high. So the market will behave differently from what you might have predicted in your technical analysis. This indicator is not best for technical traders who rely primarily on chart patterns and candlestick patterns.
However, if you are a fundamental trader, you will look at this news or event as an opportunity and based on your trading strategy, you might be able to take positions that will lead you to profit.
Conclusion:
The Economic calendar is an excellent indicator that you can use in your fundamental analysis. Also, if you are an area technical, you hen, you can take the news or Eva ent as a warning and save yourself from losses.
Download indicator