Definition
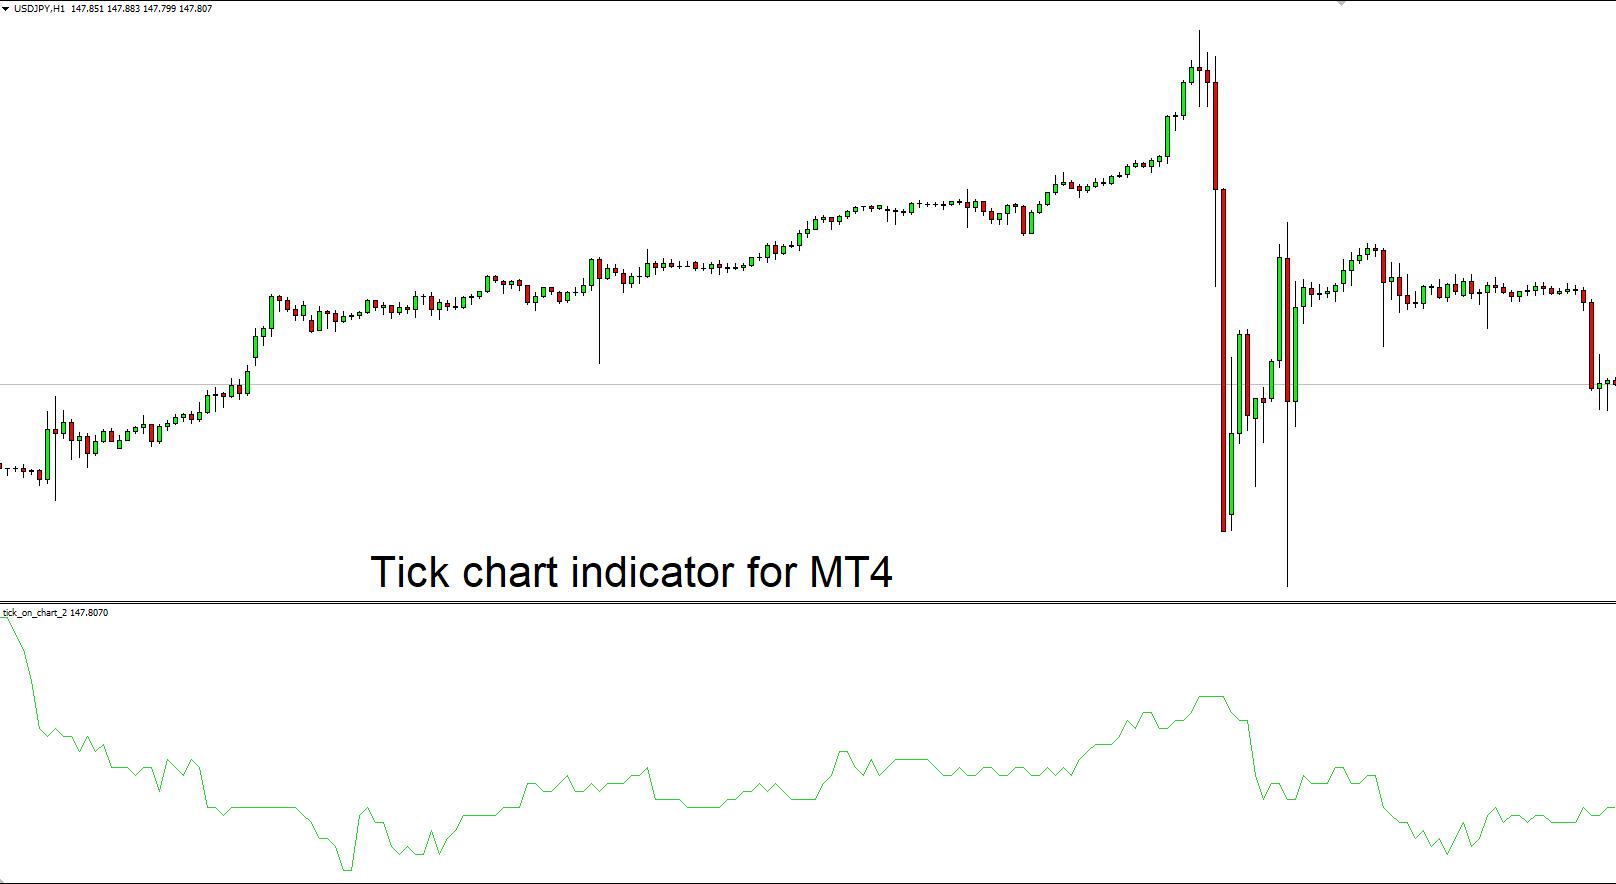
The tick indicator is an mt4 indicator that shows the number of the smallest possible movements by the price on the candlestick chart. The tick is the smallest movement of price.
For example, when traders open buy/sell orders, the price moves up and down. These slight price movements are termed price ticks.
By default, MetaTrader 4 does not display the tick chart. That’s why traders need an external indicator to show the number of ticks on the chart.
| Name | Tick chart indicator |
| Indicator Function | It shows price ticks |
| Platform | MT4 |
| File Size | 13.7 KB |
How does the tick indicator work in mt4?
The indicator plot a line in a separate window of mt4 that shows the number of ticks in a specific candlestick or timeframe.
Traders use ticks to find the institutional activity on the price chart. It is evident that market volatility increases when institutional traders and banks place orders. You can see their orders on the price chart using this tick chart. So you can also open buy or sell orders according to the direction of the significant trend.
This indicator also resembles the volume indicator in forex trading. Volume indicator also measures the number of ticks in a specific time interval and then shows the volume. Many ticks are directly proportional to institutional traders or large volumes.

How to trade using the tick chart indicator in mt4?
First, determine whether the trend is either bullish or bearish. So open the trade based on the trend direction when the number of ticks increases.
The bottom line
A trader can build a strong strategy using this tick chart indicator. It’s a very powerful indicator that can increase the winning ratio of a trading strategy.
Download indicator
