Dean Malone designed the Traders Dynamic Index TDI indicator MT4 to evaluate the state of the market and identify trade signals. TDI is a complicated indicator is built on three other well-known indicators: the RSI, Moving Average, and Bollinger Bands. The moving averages smooth through the RSI line.
Working of TDI indicator
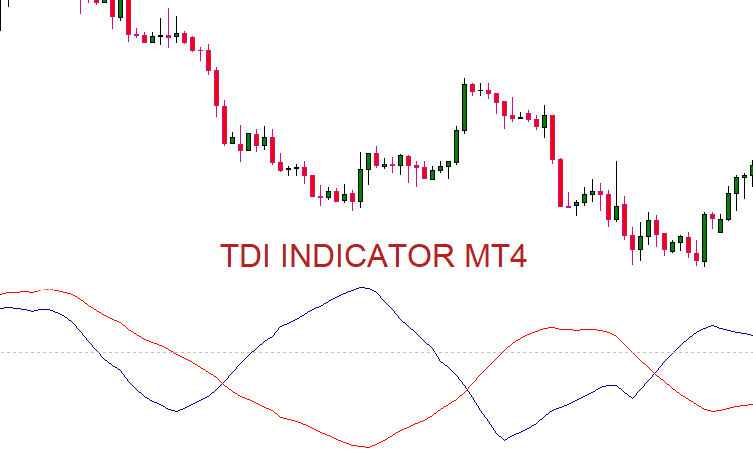
The TDI indicator MT4 appears in a separate window beneath the price chart. It consists of red and blue lines. Blue lines are also known as the fast, while the red line is an indicator and calculated using a more extended period. The two lines represent the strength of the market and the volatility. Investors can receive trading signals when the two lines intersect.
In addition to the two RSI lines, the TDI indicator also includes three bands of Bollinger. Two Blue lines represent the region between the area of 68 and 32. The central axis or middle line has yellow. The part above the 68-level is overbought. The area below 32 is oversold.
Trading Signals by TDI indicator MT4
It would be best to watch when the red and blue lines cross for trading signals. The buy signal happens if the blue line intersects the red line below. In contrast, it indicates a selling signal if it travels over the red line.
Bullish and Bearish signals
It is advisable to utilize the yellow line to gain more signals. For instance, bulls are more potent if the red line crosses the yellow line below powerful. So, investors must purchase. Also, when the red line crosses over the yellow line from top to bottom, it’s a bearish signal that should prepare you to open short positions.
The indicator will also indicate that the line crosses over the 50 32, 68, and 50 levels. The areas that are overbought indicate the possibility of a market correction.
Exit strategy
Buying
You can take profits at that next level of resistance in buy positions or whenever the blue line is crossed by the red line above.
Selling
In the case of sell positions, you can make profits at the next level of support or cross the blue line by the red line below.
Trading Example
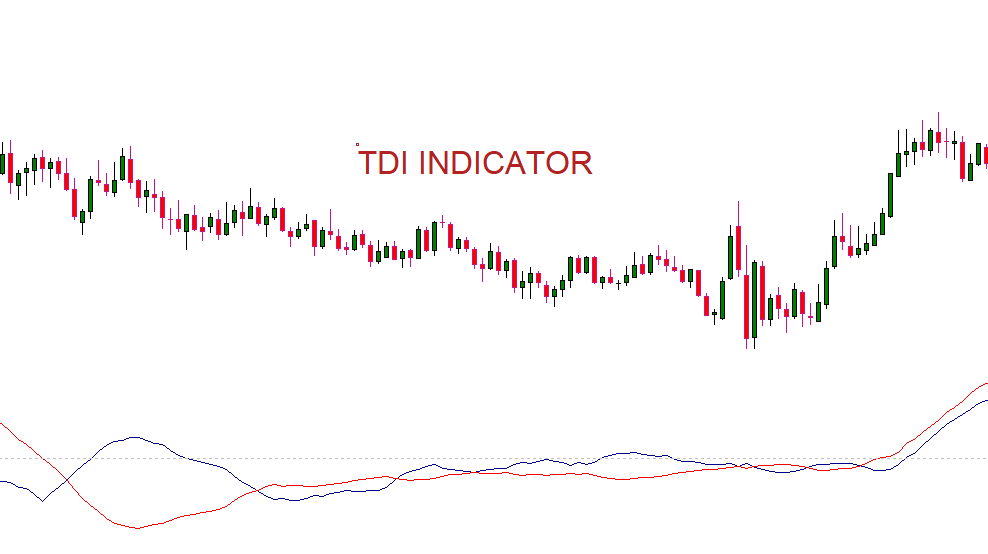
The graph above shows price movements for the GBP/JPY over the five-minute timeframe. The green line crosses the red line from above ((shown in red Arrow). In the same way, the price increases as the blue line intersect that red line below.
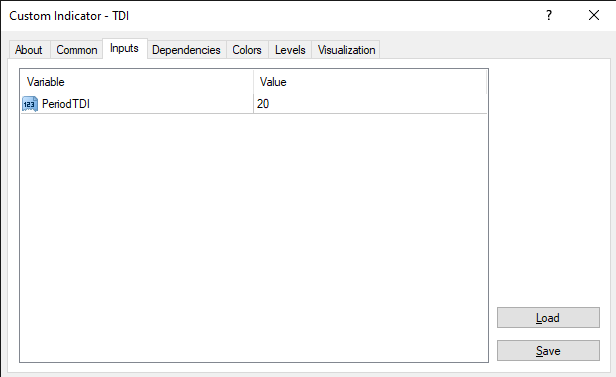
Inputs of TDI indicator
The following table shows the input parameters of the TDI Indicator mt4. Feel free to experiment with the settings for better results.
Conclusions
The Traders dynamic indicator TDI MT4 for traders is an excellent tool to detect buy and sell signals. In essence, you need to wait until the lines cross before starting trading. Keep in mind that the indicator is comingling RSI, moving averages, along with Bollinger Bands indicators. It is possible to make use of the indicator in a different strategy. However, it is recommended to integrate it with other systems to create precise trade entries.
Get your free indicator here.
Download indicator