Introduction
The Standard Deviation Channel Indicator is a powerful technical analysis tool that helps traders identify price volatility and potential trading opportunities. This indicator utilizes the concept of standard deviation to plot channels around the price chart, providing insights into the market’s volatility levels. In this article, we will explore the features, working principles, and benefits of the Standard Deviation Channel Indicator for MT5.
Features of the Standard Deviation Channel Indicator
The Standard Deviation Channel Indicator offers several features that make it a valuable tool for volatility analysis:
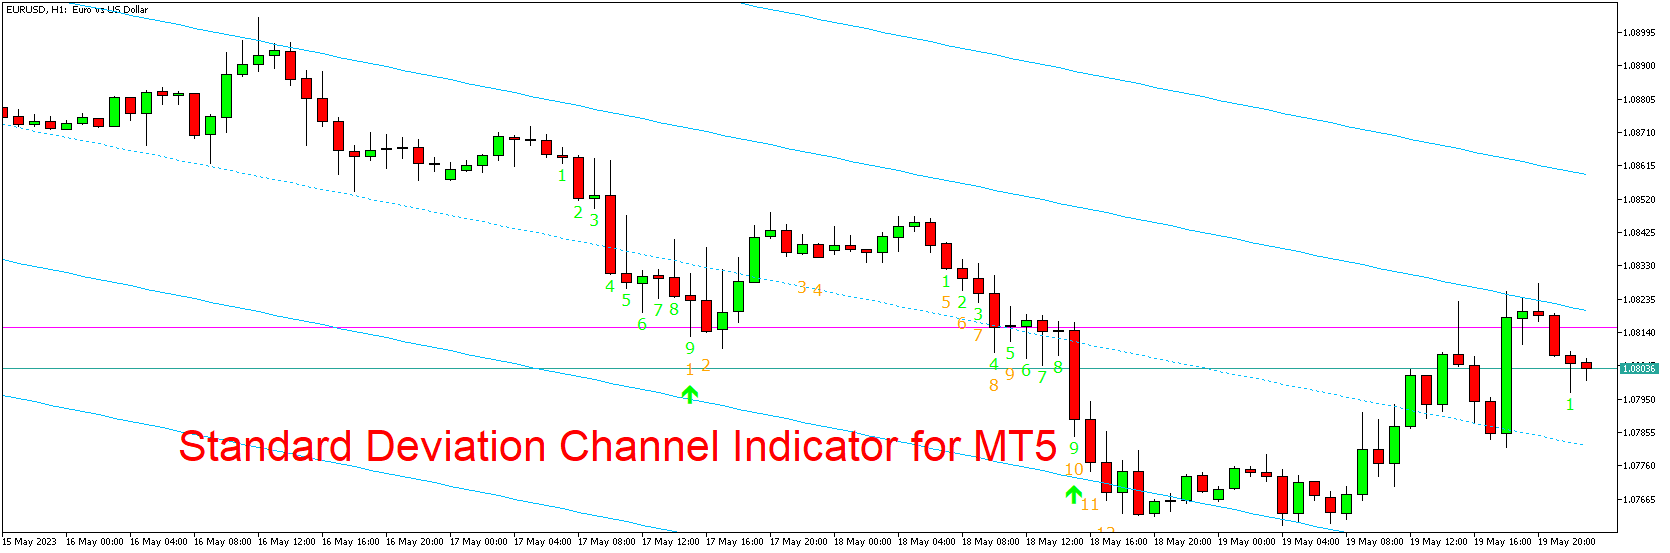
- Channel Construction: The indicator plots channels on the price chart based on the standard deviation of price movements. These channels provide visual boundaries that encapsulate the majority of price fluctuations.
- Adjustable Parameters: Traders have the flexibility to customize the parameters of the Standard Deviation Channel Indicator. They can adjust the period of calculation, the number of standard deviations, and other settings to align with their trading preferences and strategies.
- Upper and Lower Bands: The indicator generates an upper and lower band that represents the standard deviation above and below the moving average. These bands act as dynamic support and resistance levels, indicating potential price reversal points.
- Volatility Assessment: The Standard Deviation Channel Indicator helps traders assess the market’s volatility. Wide channels indicate high volatility, while narrow channels suggest low volatility. Traders can use this information to adjust their trading strategies accordingly.
- Trend Identification: By observing the position of the price within the channel, traders can identify the prevailing trend. When the price consistently stays above the channel, it indicates an uptrend, whereas prices below the channel suggest a downtrend.
Working Principles of the Standard Deviation Channel Indicator
The Standard Deviation Channel Indicator operates based on the principles of standard deviation and volatility analysis:
- Calculation of Standard Deviation: The indicator calculates the standard deviation of price data over a specified period. This statistical measure quantifies the dispersion of price movements around the moving average.
- Channel Formation: The indicator plots upper and lower bands around the moving average based on the standard deviation. The width of the channels reflects the volatility of the price data.
- Volatility Assessment: Traders can assess the market’s volatility by observing the width of the channels. Wider channels indicate higher volatility, suggesting potential trading opportunities, while narrower channels imply lower volatility and may indicate consolidation periods.
- Support and Resistance Levels: The upper and lower bands of the Standard Deviation Channel act as dynamic support and resistance levels. Traders can anticipate potential price reversals or breakouts when the price approaches these levels.
Benefits of the Standard Deviation Channel Indicator
- Volatility Analysis: The Standard Deviation Channel Indicator allows traders to gauge the market’s volatility levels. This information is crucial for adapting trading strategies, setting appropriate profit targets, and managing risk.
- Trend Identification: By observing the position of the price within the channel, traders can determine the prevailing trend. This insight helps traders align their positions with the overall market direction.
- Support and Resistance Levels: The upper and lower bands of the channel serve as dynamic support and resistance levels. Traders can use these levels to identify potential areas of price reversal or breakout.
- Confirmation Tool: The Standard Deviation Channel Indicator can be used in conjunction with other technical analysis tools as a confirmation tool. Traders can combine it with trend lines, chart patterns, or other indicators to enhance the accuracy of their trading signals.
- Customization Options: The indicator offers customization options, allowing traders to adjust the parameters according to their trading preferences. This flexibility makes it adaptable to different trading styles and strategies.
Conclusion
The Standard Deviation Channel Indicator is a valuable tool for analyzing price volatility and identifying potential trading opportunities. With its ability to plot channels based on standard deviation, traders can gain insights into market volatility levels and make more informed trading decisions. Download the Standard Deviation Channel Indicator for MT5 and incorporate it into your technical analysis toolkit to enhance your understanding of market volatility and improve your trading outcomes.
Download indicator