Introduction
The RSI Heatmap Indicator is a powerful tool designed for the MetaTrader 5 platform that helps traders analyze the strength and momentum of price movements using the Relative Strength Index (RSI) indicator. By providing a visual representation of the RSI values across multiple timeframes, the RSI Heatmap Indicator enables traders to identify potential trend reversals, overbought or oversold conditions, and divergence patterns. In this article, we will explore the features, working principles, and benefits of the RSI Heatmap Indicator for MT5.
Features of the RSI Heatmap Indicator
The RSI Heatmap Indicator offers several features that make it a valuable tool for traders:
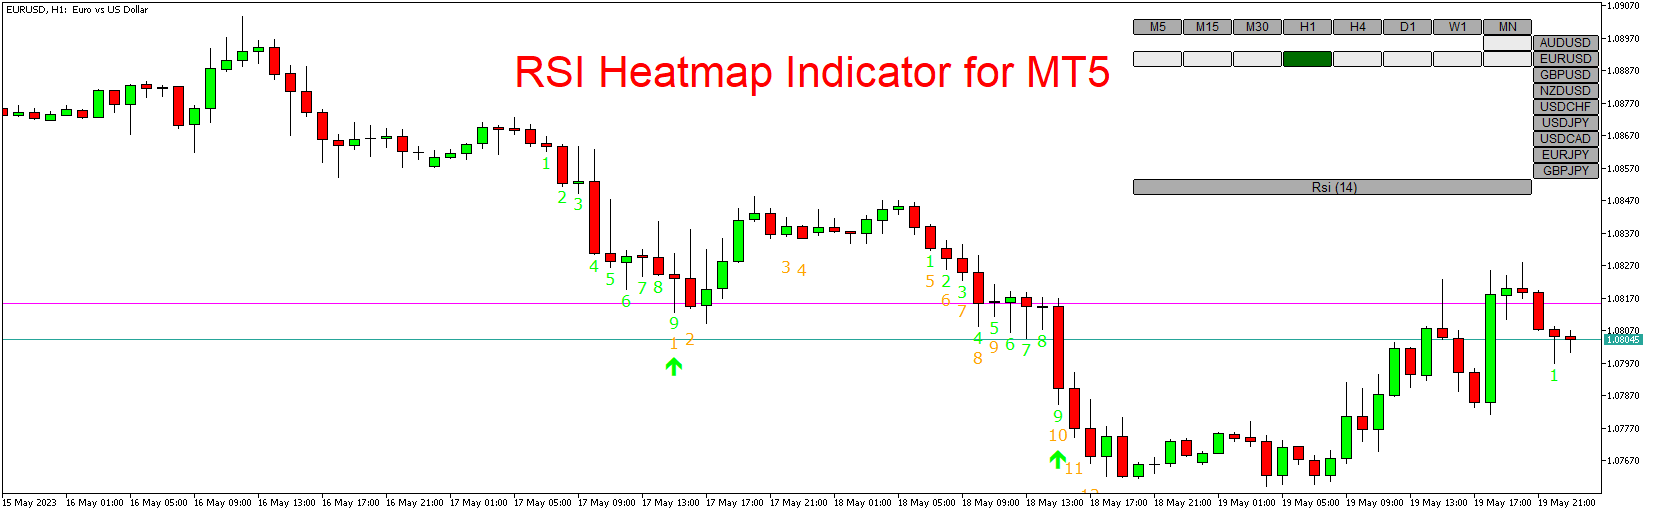
- Multi-Timeframe Analysis: The RSI Heatmap Indicator allows traders to analyze RSI values across multiple timeframes, such as M1, M5, M15, H1, H4, and more. This provides a comprehensive view of RSI strength and helps identify trend strength or weakness across different time horizons.
- Heatmap Visualization: The indicator presents RSI values in a visually appealing heatmap format, making it easier for traders to interpret and understand the strength and momentum of price movements. The heatmap displays different colors to represent varying RSI levels, allowing for quick identification of overbought and oversold conditions.
- Customizable Parameters: Traders can customize the RSI Heatmap Indicator’s parameters to suit their trading preferences. They can adjust the RSI period, the color scheme of the heatmap, and other settings to align with their trading strategy and preferences.
- Divergence Detection: The RSI Heatmap Indicator helps traders identify potential divergence patterns between price and RSI. Divergence occurs when the RSI and price move in opposite directions, signaling a potential trend reversal. By spotting divergence patterns on multiple timeframes, traders can gain insights into potential market reversals.
Working Principles of the RSI Heatmap Indicator
The RSI Heatmap Indicator calculates and visualizes the RSI values across multiple timeframes. Its working principles include the following:
- RSI Calculation: The RSI Heatmap Indicator calculates the RSI values for each selected timeframe based on the specified RSI period. The RSI is a momentum oscillator that measures the speed and change of price movements. It oscillates between 0 and 100, with readings above 70 indicating overbought conditions and readings below 30 indicating oversold conditions.
- Heatmap Visualization: The indicator presents the RSI values in a heatmap format, where each timeframe is represented by a row and each column represents a specific RSI level. The heatmap uses different colors to represent varying RSI levels, allowing for quick identification of overbought and oversold conditions across different timeframes.
- Interpretation of the Heatmap: Traders can interpret the heatmap by observing the distribution of colors. Areas with darker shades or specific color patterns may indicate strong overbought or oversold conditions, suggesting potential price reversals. Conversely, areas with lighter shades or different color patterns may indicate neutral or balanced market conditions.
- Divergence Analysis: Traders can use the RSI Heatmap Indicator to spot potential divergence patterns between price and RSI. Divergence occurs when the RSI and price move in opposite directions. Bullish divergence occurs when price forms lower lows while the RSI forms higher lows, indicating a potential bullish reversal. Bearish divergence occurs when price forms higher highs while the RSI forms lower highs, signaling a potential bearish reversal.
Benefits of the RSI Heatmap Indicator
- Comprehensive Analysis: The RSI Heatmap Indicator provides a comprehensive analysis of RSI strength across multiple timeframes, enabling traders to make more informed trading decisions. By considering the RSI values on different time horizons, traders can assess the overall trend strength and potential reversals more effectively.
- Visual Representation: The heatmap visualization of the RSI Heatmap Indicator simplifies the interpretation of RSI values. Traders can quickly identify overbought or oversold conditions and spot potential divergence patterns without the need for complex calculations or manual analysis.
- Confirmation of Trading Signals: The RSI Heatmap Indicator can be used to confirm other trading signals or indicators. For example, if a trading strategy generates a buy signal on the daily timeframe, traders can use the heatmap to check if the RSI values align with the bullish signal across multiple timeframes, increasing the confidence in the trade.
- Flexibility and Customization: The RSI Heatmap Indicator offers flexibility and customization options, allowing traders to adjust the indicator parameters to suit their trading style and preferences. Traders can customize the RSI period, color scheme, and other settings to align with their trading strategy.
Conclusion
The RSI Heatmap Indicator for MT5 is a powerful tool for traders seeking to analyze the strength and momentum of price movements using the Relative Strength Index (RSI). With its multi-timeframe analysis, heatmap visualization, and ability to detect divergences, the RSI Heatmap Indicator enhances traders’ understanding of market dynamics and assists in making informed trading decisions. By downloading the RSI Heatmap Indicator for MT5, traders can leverage its features to gain valuable insights into RSI strength across multiple timeframes and improve their trading strategies.
Download indicator