Introduction
The Moving Average Ribbon Indicator is a popular technical analysis tool used by traders to identify trends and potential entry and exit points in the market. This indicator consists of multiple moving averages plotted on the price chart, forming a ribbon-like pattern. In this article, we will explore the features, working principles, and benefits of the Moving Average Ribbon Indicator for MT5.
Features of the Moving Average Ribbon Indicator
The Moving Average Ribbon Indicator offers several features that make it a powerful tool for trend analysis:
- Multiple Moving Averages: The indicator plots multiple moving averages simultaneously on the price chart. Traders can choose different periods for these moving averages, such as 10-day, 20-day, or 50-day, to capture different timeframes and trends.
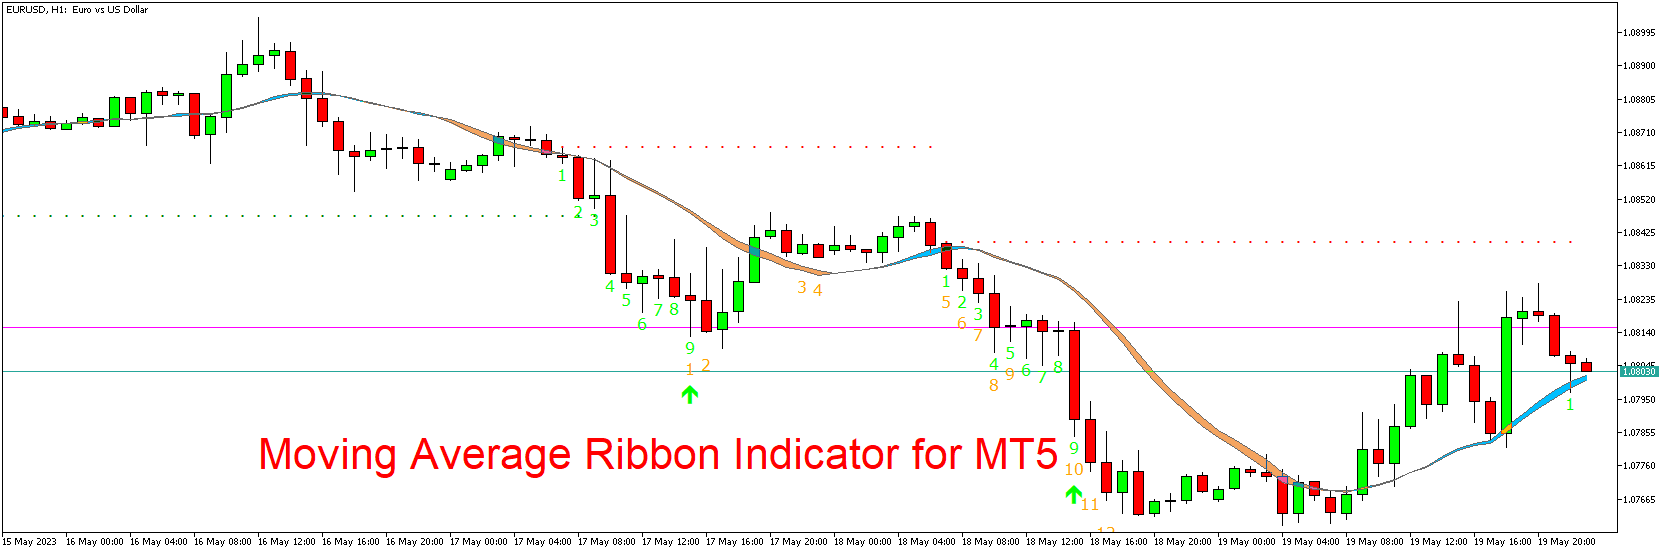
- Ribbon Visualization: The moving averages are displayed as a ribbon, creating a visually appealing and informative representation of the trend. The ribbon can provide a clear indication of the direction and strength of the trend.
- Customizable Parameters: Traders have the flexibility to customize the parameters of the Moving Average Ribbon Indicator. They can adjust the periods of the moving averages, the colors of the ribbon, and other visual settings to align with their trading preferences and strategies.
- Trend Identification: The indicator helps identify the prevailing trend in the market. By observing the positioning and slope of the ribbon, traders can determine whether the market is in an uptrend, downtrend, or a sideways consolidation phase.
- Support and Resistance Levels: The Moving Average Ribbon Indicator can also serve as dynamic support and resistance levels. Traders often observe price reactions around the ribbon to identify potential entry or exit points.
Working Principles of the Moving Average Ribbon Indicator
The Moving Average Ribbon Indicator operates based on the principles of moving averages and trend analysis:
- Calculation of Moving Averages: The indicator calculates and plots multiple moving averages on the price chart. Each moving average represents the average price over a specific period.
- Ribbon Formation: The moving averages are plotted close to each other, forming a ribbon-like pattern on the chart. The proximity of the moving averages provides a visual representation of the trend strength and consistency.
- Trend Confirmation: Traders observe the positioning and slope of the ribbon to confirm the prevailing trend. An upward slope indicates an uptrend, a downward slope indicates a downtrend, and a flat or interweaving ribbon suggests a sideways market.
- Entry and Exit Signals: Traders can use the Moving Average Ribbon Indicator to generate entry and exit signals. For example, a bullish signal may occur when the price crosses above the ribbon, indicating a potential uptrend. Conversely, a bearish signal may occur when the price crosses below the ribbon, suggesting a potential downtrend.
Benefits of the Moving Average Ribbon Indicator
- Trend Identification: The Moving Average Ribbon Indicator is highly effective in identifying trends in the market. It helps traders determine the overall direction and strength of the trend, enabling them to align their trading strategies accordingly.
- Visual Clarity: The ribbon visualization of the moving averages provides clear and intuitive information about the market trend. Traders can quickly assess the trend dynamics by observing the ribbon pattern without the need for complex calculations.
- Support and Resistance Levels: The Moving Average Ribbon Indicator can act as dynamic support and resistance levels. Traders can use these levels to identify potential areas of price reversals or breakouts.
- Versatility: The indicator can be applied to various timeframes and markets, making it suitable for different trading styles and strategies. Traders can adjust the periods of the moving averages to match their preferred timeframes and market analysis.
- Confirmation Tool: The Moving Average Ribbon Indicator can be used as a confirmation tool in conjunction with other technical analysis techniques. Traders can combine it with other indicators or chart patterns to enhance the accuracy of their trading signals.
Conclusion
The Moving Average Ribbon Indicator is a valuable tool for traders seeking to analyze trends and identify potential trading opportunities. With its multiple moving averages displayed as a ribbon on the price chart, this indicator provides visual clarity and helps traders make informed decisions. Download the Moving Average Ribbon Indicator for MT5 and incorporate it into your trading strategy to enhance your trend analysis and improve your trading outcomes.
Download indicator