CCI histogram MT4 is one of the best trading indicators which displays bearish, bullish, and flat trends. This CCI Histogram Indicator is based on the highly efficient and results-oriented Meta trader indicator, the Woodies Commodity Channel Index (Woodies CCI). The indicator displays three different market conditions on the histogram:
- Bullish
- Bearish
- Flat
Being a non-repaint indicator for MT4, forex traders can easily rely on trading signals. The hand changes color with the CCI reversal. Therefore, It is pretty convenient to trade using the histogram. Additionally, forex traders can easily integrate it into any trend-based trading technique.
CCI histogram is straightforward and valid for new as well as experienced traders. It is effective in short-term and long-term forex trading strategies and works in any timeframe.
Trading setup of CCI Histogram MT4

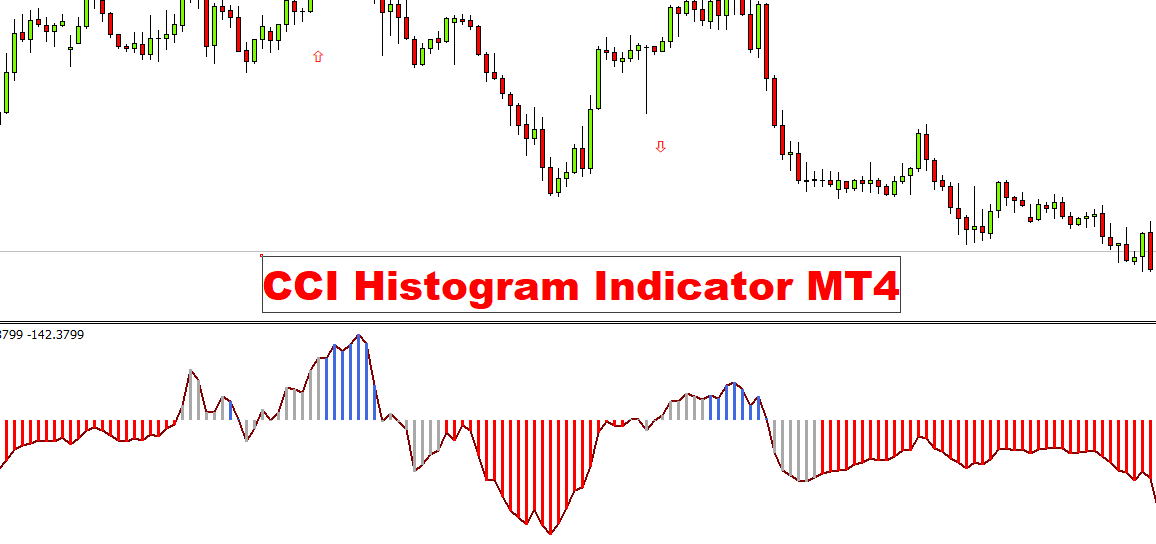
The above EURUSD M30 chart shows the CCI Histogram. The indicator shows the BULLISH trend as BLUE color and the BEARISH trend as RED color. Additionally, the indicator displays the FLAT trend as DARK GRAY.
Learn more about Zup Harmonic Indicator
Buying and Selling using CCI Histogram
CCI histogram provides visual indication for buying and selling.
Buying
When the CCI Histogram Indicator for MT4 displays in BLUE, Forex traders can start to BUY trade since it signifies the start of a BULLISH trend. The traders can set a stop-loss lower than the previous low. Forex traders can make use of the indicator’s ability to show its FLAT trend.
The histogram transforms to a DARK GRAY, signaling a weak uptrend or a FLAT trend. Traders can exit a trading position.
Selling
RED lines of the CCI Histogram indicator MT4 indicate the beginning of the new BEARISH trend. Forex traders may take a position to sell with stops that are higher than the previous highest. The traders can keep their position until the histogram shifts to DARK GRAY, suggesting a flat trend.
However, aggressive traders could overlook the change in the trend and then exit and enter after the color shift of histogram from RED to BLUE and reverse. Forex traders can place SELL and BUY signals close to the support and resistance lines to get the best results since these lines indicate a possibility of a change in direction.
CCI histogram Indicator inputs
The following table shows the CCI indicator inputs.

Since the CCI Histogram is a non-repaint indicator, traders who trade in the technical forex market can change the signals using channels, trendlines, and breakout trading strategies. In addition, the signals of the indicator can be easily programmed to enable automatic trading.
Conclusions
The CCI histogram Indicator MT4 is the ideal Meta trader indicator for any trend trading strategy. Trend traders in the forex market will benefit from the indicator’s capacity to detect the FLAT trend and BULLISH and BEARISH trends. Furthermore, the BUY-SELL signals, entry signals, and exit signals are easily recognized by traders using a visual. Moreover, the indicator is completely available for download as well as installation.
Download indicator